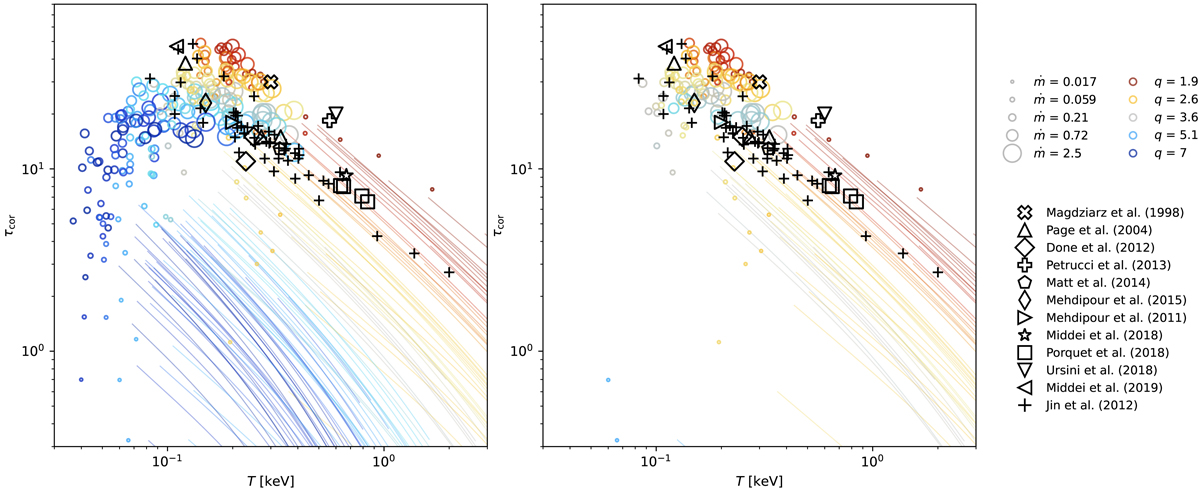
Fig. 7.
Download original image
Parameters of the corona τcor and Tavg determined for a random sample of models are marked by open circles. The size of the points determines the accretion rate and color of the points corresponds to the magnetic field gradient (similar to Fig. 6) given on the right side of the figure. For models where the TI is present, the values of τ and Tavg computed at every point of the instability are displayed by thin lines. In the left panel, all models are shown, while in the right panel, models where the density inversion occurs (see Sect. 2.4) are filtered out. Additionally, data points from the literature are drawn using black markers listed on the right side of the figure. The data points clearly follow TI strips.
Current usage metrics show cumulative count of Article Views (full-text article views including HTML views, PDF and ePub downloads, according to the available data) and Abstracts Views on Vision4Press platform.
Data correspond to usage on the plateform after 2015. The current usage metrics is available 48-96 hours after online publication and is updated daily on week days.
Initial download of the metrics may take a while.