Fig. 8.
Download original image
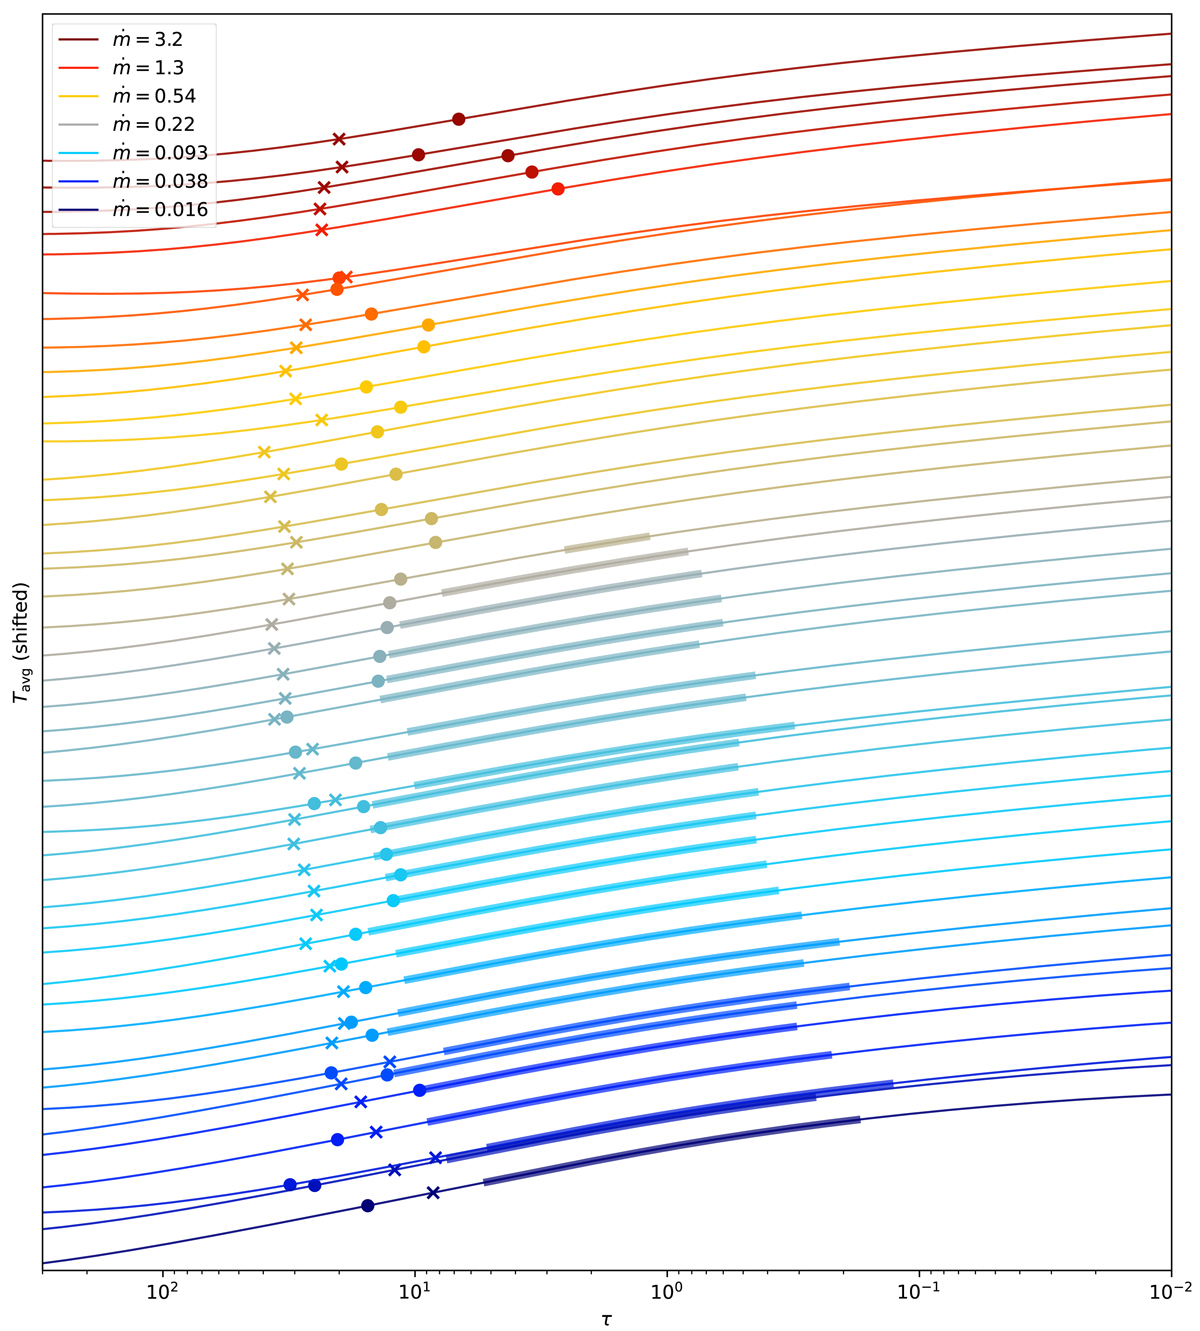
Profiles of averaged temperature versus the optical depth for fine-tune models. The temperature is averaged between the optical depth given by the coordinate of the horizontal axis and the surface of the corona. Thicker lines are overlayed to indicate where the condition for the TI is fulfilled. Circle markers are temperatures and optical depths obtained by Jin et al. (2012). Cross markers indicate the averaged temperature at τcor of a given model. Magnetic parameters are adjusted so that the temperature profile crosses the observational point. Each profile is shifted slightly for a clearer presentation and models are sorted according to the accretion rate, ṁ.
Current usage metrics show cumulative count of Article Views (full-text article views including HTML views, PDF and ePub downloads, according to the available data) and Abstracts Views on Vision4Press platform.
Data correspond to usage on the plateform after 2015. The current usage metrics is available 48-96 hours after online publication and is updated daily on week days.
Initial download of the metrics may take a while.