Fig. 5.
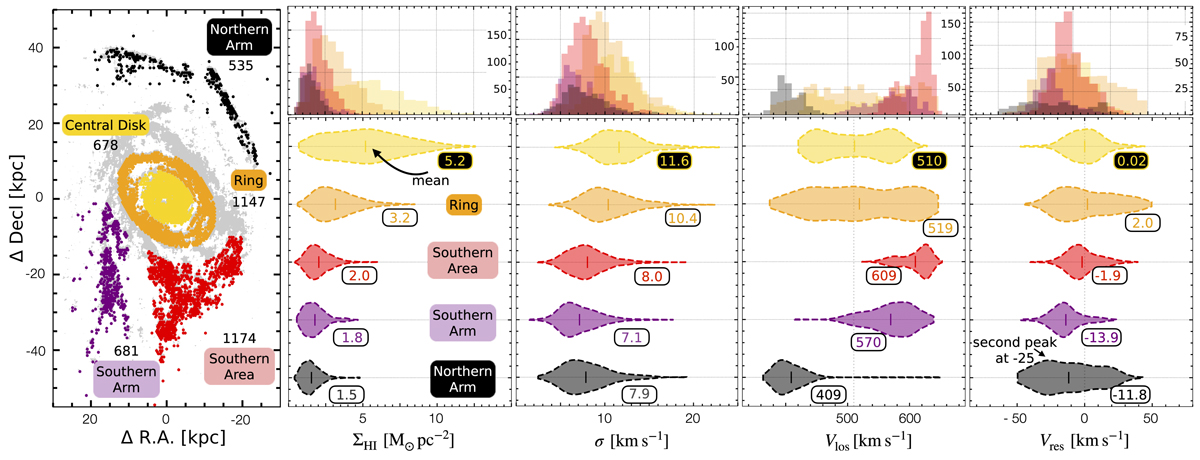
Download original image
Environmental differences in velocities, H I gas surface density and velocity dispersion in M 83. Mask: colors represent the different regions: central disk, ring, southern area, northern arm and the southern arm. We note the total sightlines for each of the regions. The grey colors in the background show the H I column density contours (NHI = 13 × 1019 cm−2) that we showed in Fig. 1. Violin plots: each violin represents the distribution of each quantity in a region defined in the mask. We set the kernel density estimation (KDE) to compute an empirical distribution of each quantity to 200 points. The columns on the x axis show the H I gas surface density ΣHI, the second the line width σeff, the observed velocities Vlos, and the last residual velocities Vres. The mean value of the observed quantity is reported for each violin. The long tails seen for example in the Vlos violin for the northern arm represents that there is one discrepant value.
Current usage metrics show cumulative count of Article Views (full-text article views including HTML views, PDF and ePub downloads, according to the available data) and Abstracts Views on Vision4Press platform.
Data correspond to usage on the plateform after 2015. The current usage metrics is available 48-96 hours after online publication and is updated daily on week days.
Initial download of the metrics may take a while.