Fig. 7.
Download original image
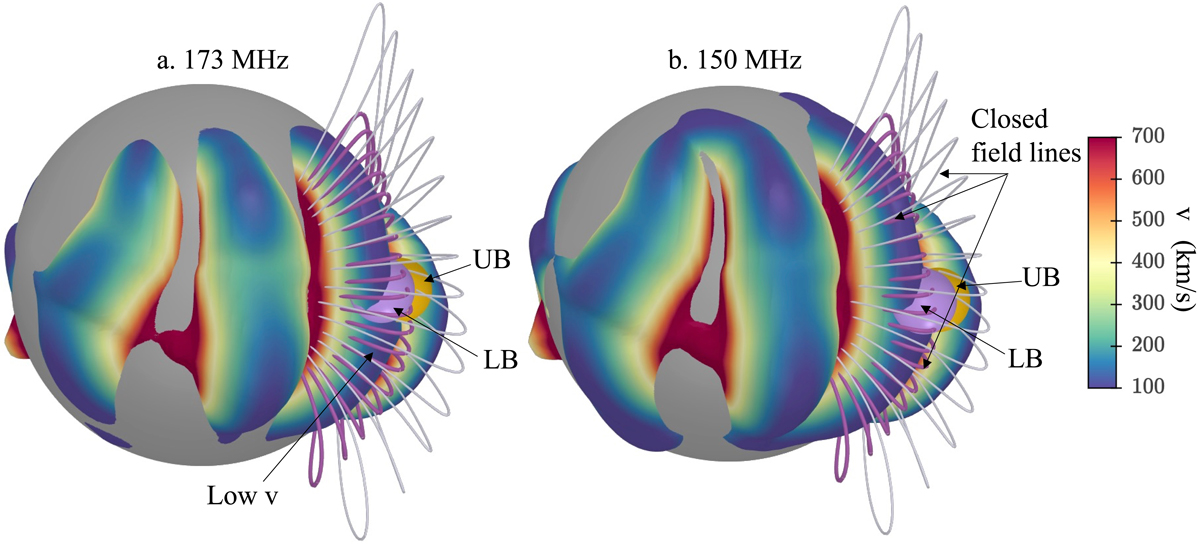
Macro-scale properties of the corona where the type II burst originates. The height of the plasma density level corresponding to the harmonic plasma frequency of 173 and 150 MHz is shown as a 3D surface in panels a and b, respectively. The grey sphere has a radius of 1.2 R⊙ to help visualise the enhanced density regions. Overlaid on the density surface are the values of Alfvén speed in km s−1 at the corresponding height. The 3D location of the UB and LB centroids of the type II burst are represented by orange and purple spheres, respectively, at the times presented in Figs. 2b–d. Also overlaid on the density surface in the region where the type II centroids originate are closed magnetic field lines forming a coronal streamer.
Current usage metrics show cumulative count of Article Views (full-text article views including HTML views, PDF and ePub downloads, according to the available data) and Abstracts Views on Vision4Press platform.
Data correspond to usage on the plateform after 2015. The current usage metrics is available 48-96 hours after online publication and is updated daily on week days.
Initial download of the metrics may take a while.