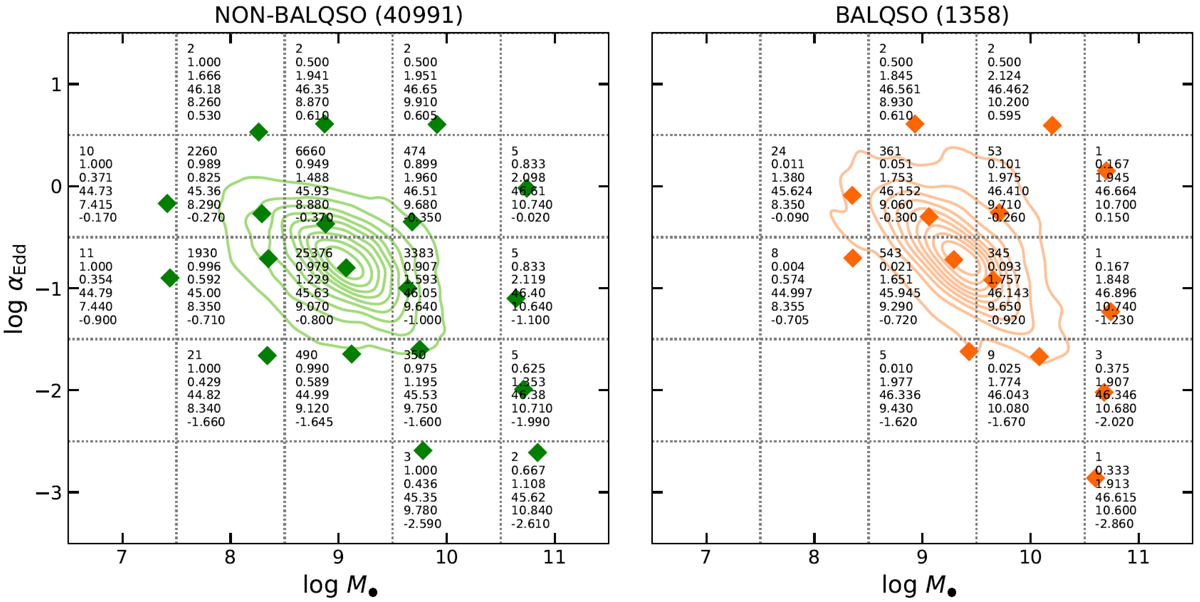
Fig. 6.
Download original image
Black hole mass and Eddington ratio space for non-BAL QSO (left panel) and BAL QSO (right panel). The space is divided into bins centred at Δlog M• = [7.0, 8.0, 9.0, 10.0] and Δlog αEdd = [ − 2.0, − 1.0, 0.0]. The contours correspond to the full sample for each case, and the diamond symbols correspond to the median values of log M• and log αEdd in each bin. The number of sources, the ratio of non-BAL QSO (or BAL QSO) to the total sample size, and the median values of redshift, log L3000, log M•, and log αEdd are listed in each bin.
Current usage metrics show cumulative count of Article Views (full-text article views including HTML views, PDF and ePub downloads, according to the available data) and Abstracts Views on Vision4Press platform.
Data correspond to usage on the plateform after 2015. The current usage metrics is available 48-96 hours after online publication and is updated daily on week days.
Initial download of the metrics may take a while.