Fig. B.1.
Download original image
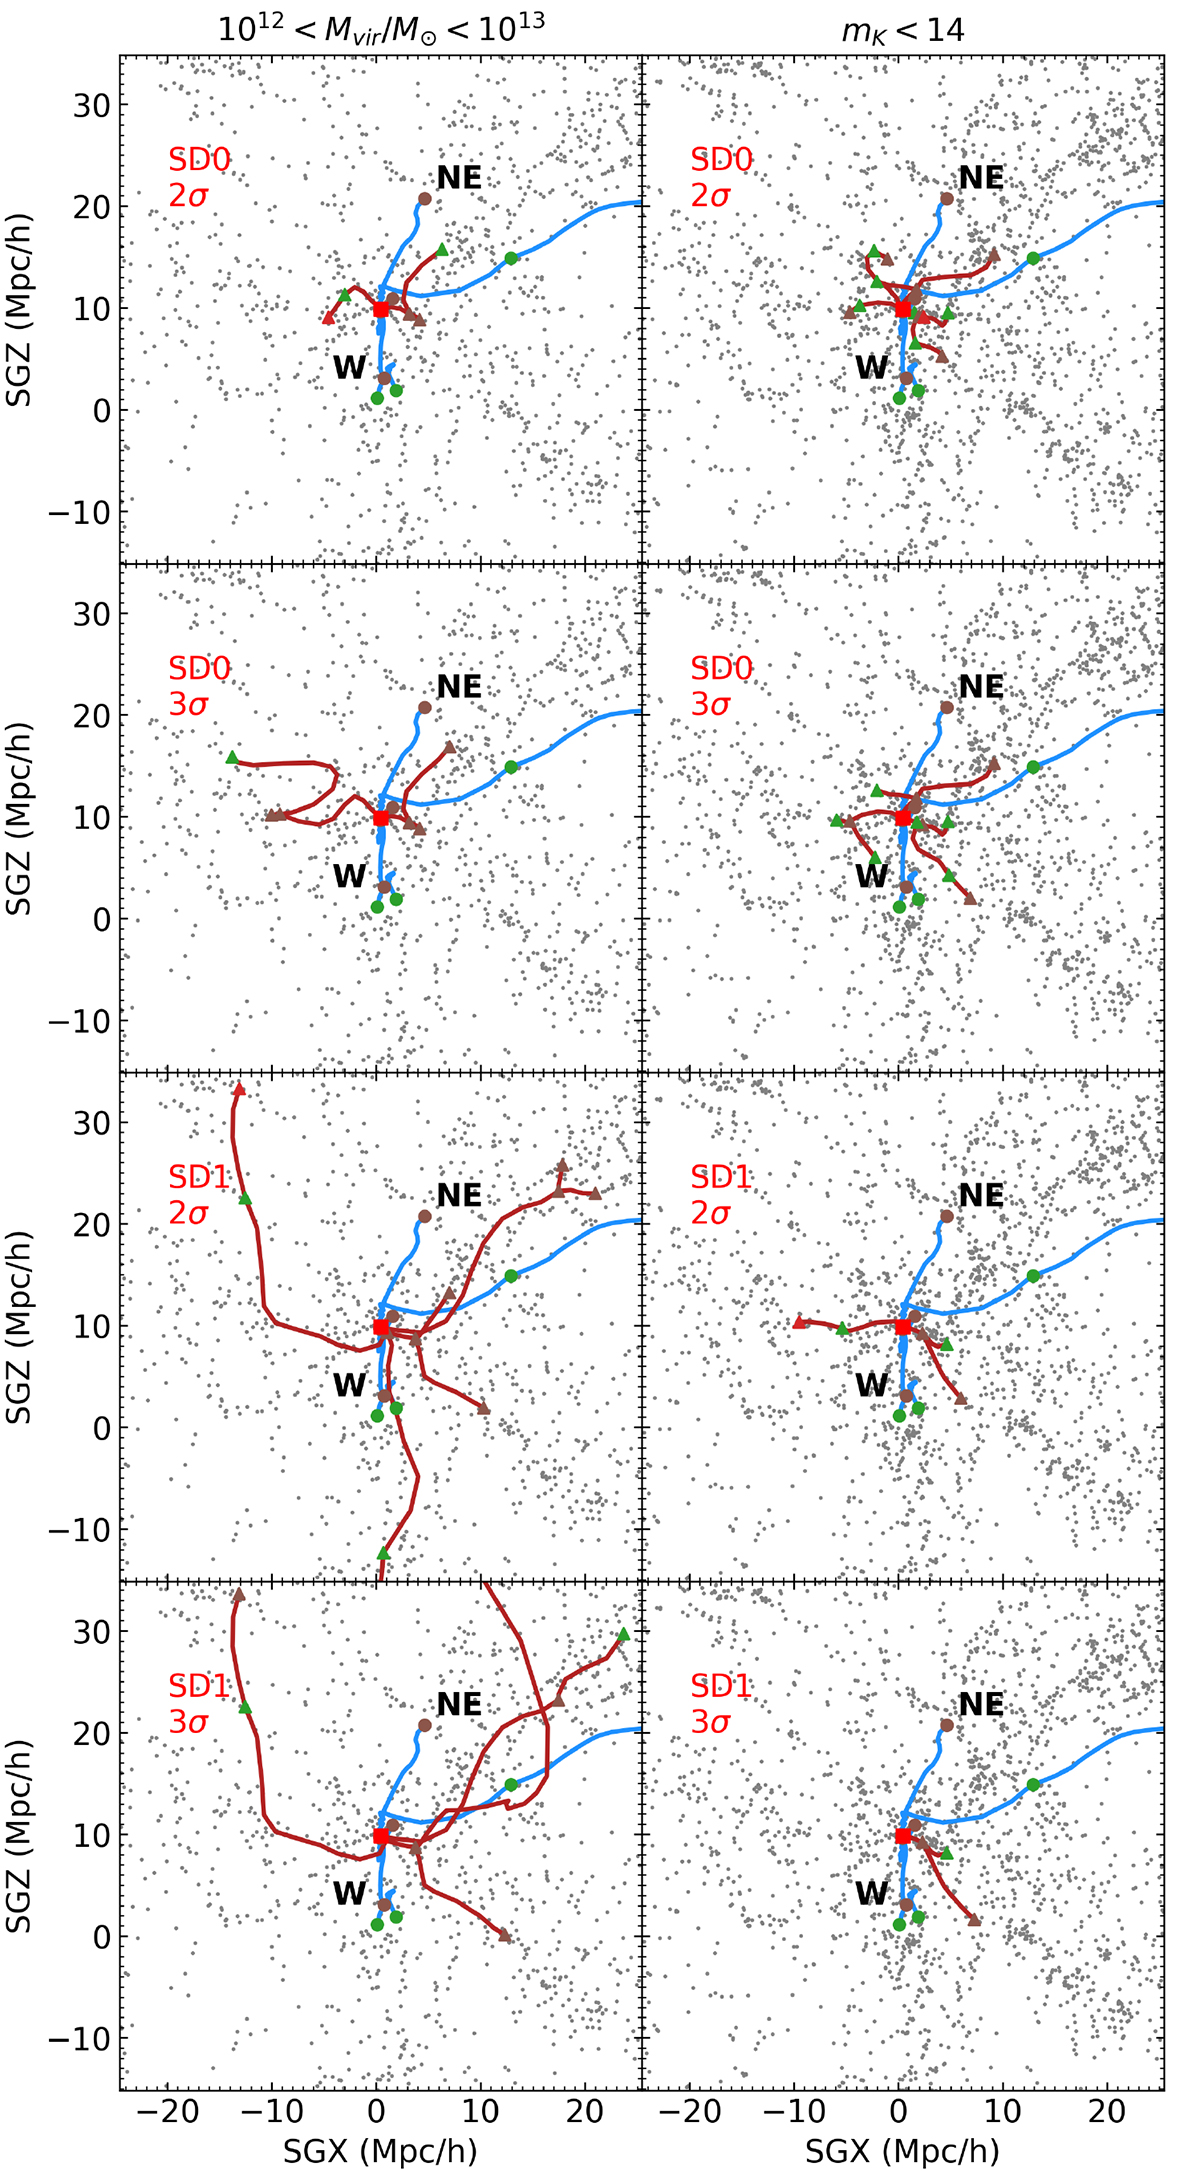
Filaments in the constrained simulation compared to filaments in observations. The left column shows the case of a mass selected galaxy sample in the constrained simulation, the right column shows the case of a magnitude selected galaxy sample. In each panel, simulated galaxies are shown as gray points. Blue lines are filaments from Malavasi et al. (2020b) in supergalactic coordinates, the red square marks the position of the Coma cluster. Dark red lines are filaments obtained in the simulation with a variety of DisPerSE parameter combinations, namely: SD0−2σ (top row), SD0−3σ (second row), SD1−2σ (third row), SD1−3σ (bottom row). Circle and triangles mark the positions of critical points (in observations and simulations, respectively) and are color-coded according to their type (red: maxima, green: type 2 saddles, brown: bifurcations). This figure shows the SGX-SGZ projection (in this projection, the increasing redshift direction is along the y axis). The observed northeast and west filaments are marked for reference.
Current usage metrics show cumulative count of Article Views (full-text article views including HTML views, PDF and ePub downloads, according to the available data) and Abstracts Views on Vision4Press platform.
Data correspond to usage on the plateform after 2015. The current usage metrics is available 48-96 hours after online publication and is updated daily on week days.
Initial download of the metrics may take a while.