Fig. 9
Download original image
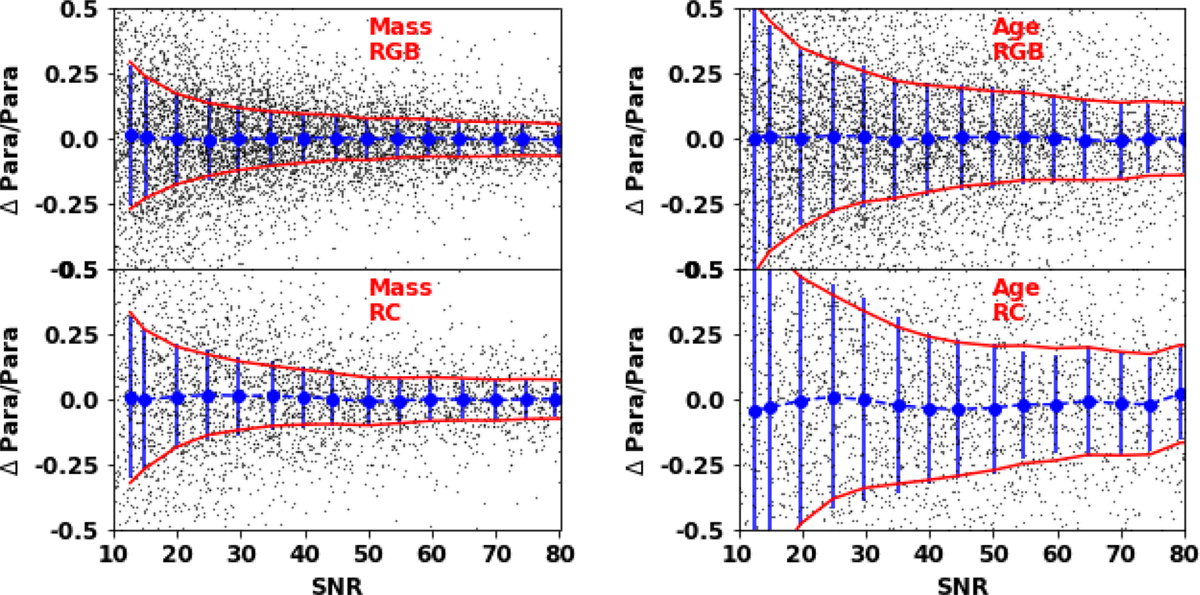
Relative internal residuals of our masses (left panels) and ages (right panels) estimated using spectra given by duplicate observations with similar spectral S/N for LAMOST RGB (top panels) and RC (bottom panels) stars. Black dots are the differences of duplicate observations of S/N differences smaller than 10%. Blue dots and error bars represent the median values and standard deviations (after dividing by ![]() ) of the relative residuals in the individual spectral S/N bins. Red lines indicate fits of the standard deviations as a function of spectral S/N.
) of the relative residuals in the individual spectral S/N bins. Red lines indicate fits of the standard deviations as a function of spectral S/N.
Current usage metrics show cumulative count of Article Views (full-text article views including HTML views, PDF and ePub downloads, according to the available data) and Abstracts Views on Vision4Press platform.
Data correspond to usage on the plateform after 2015. The current usage metrics is available 48-96 hours after online publication and is updated daily on week days.
Initial download of the metrics may take a while.