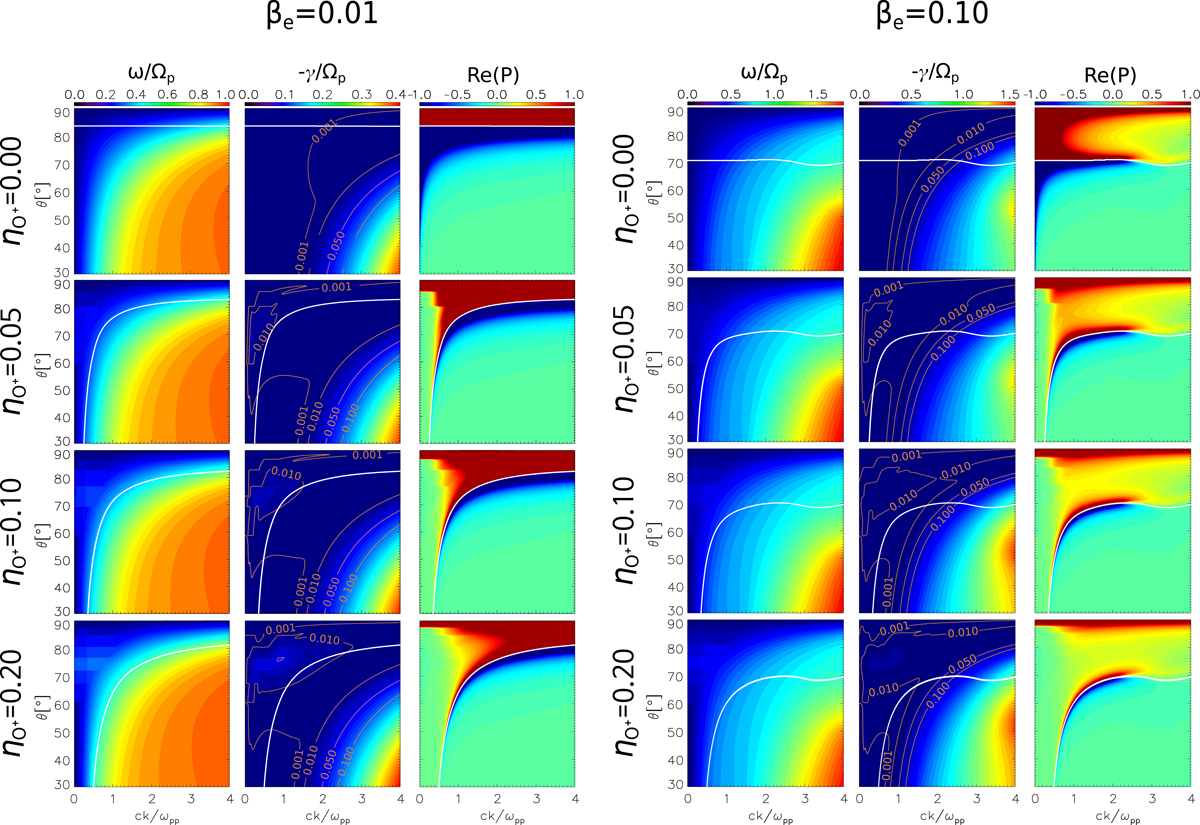
Fig. 3.
Download original image
Heat maps of the real part of the normalized frequency ω/Ωp, negative normalized damping rate −γ/Ωp, and real polarization P for Alfvénic waves as functions of the propagation angle and wavenumber for the four oxygen ion concentrations considered in this study, each displayed in a different row. The orange-colored curves display contour curves of characteristic values of the damping rate, while the white curves correspond to the contour plot of Re(P) = 0. The beta parameter is set at βe = 0.01 (left) and βe = 0.10 (right), assuming isothermy between species.
Current usage metrics show cumulative count of Article Views (full-text article views including HTML views, PDF and ePub downloads, according to the available data) and Abstracts Views on Vision4Press platform.
Data correspond to usage on the plateform after 2015. The current usage metrics is available 48-96 hours after online publication and is updated daily on week days.
Initial download of the metrics may take a while.