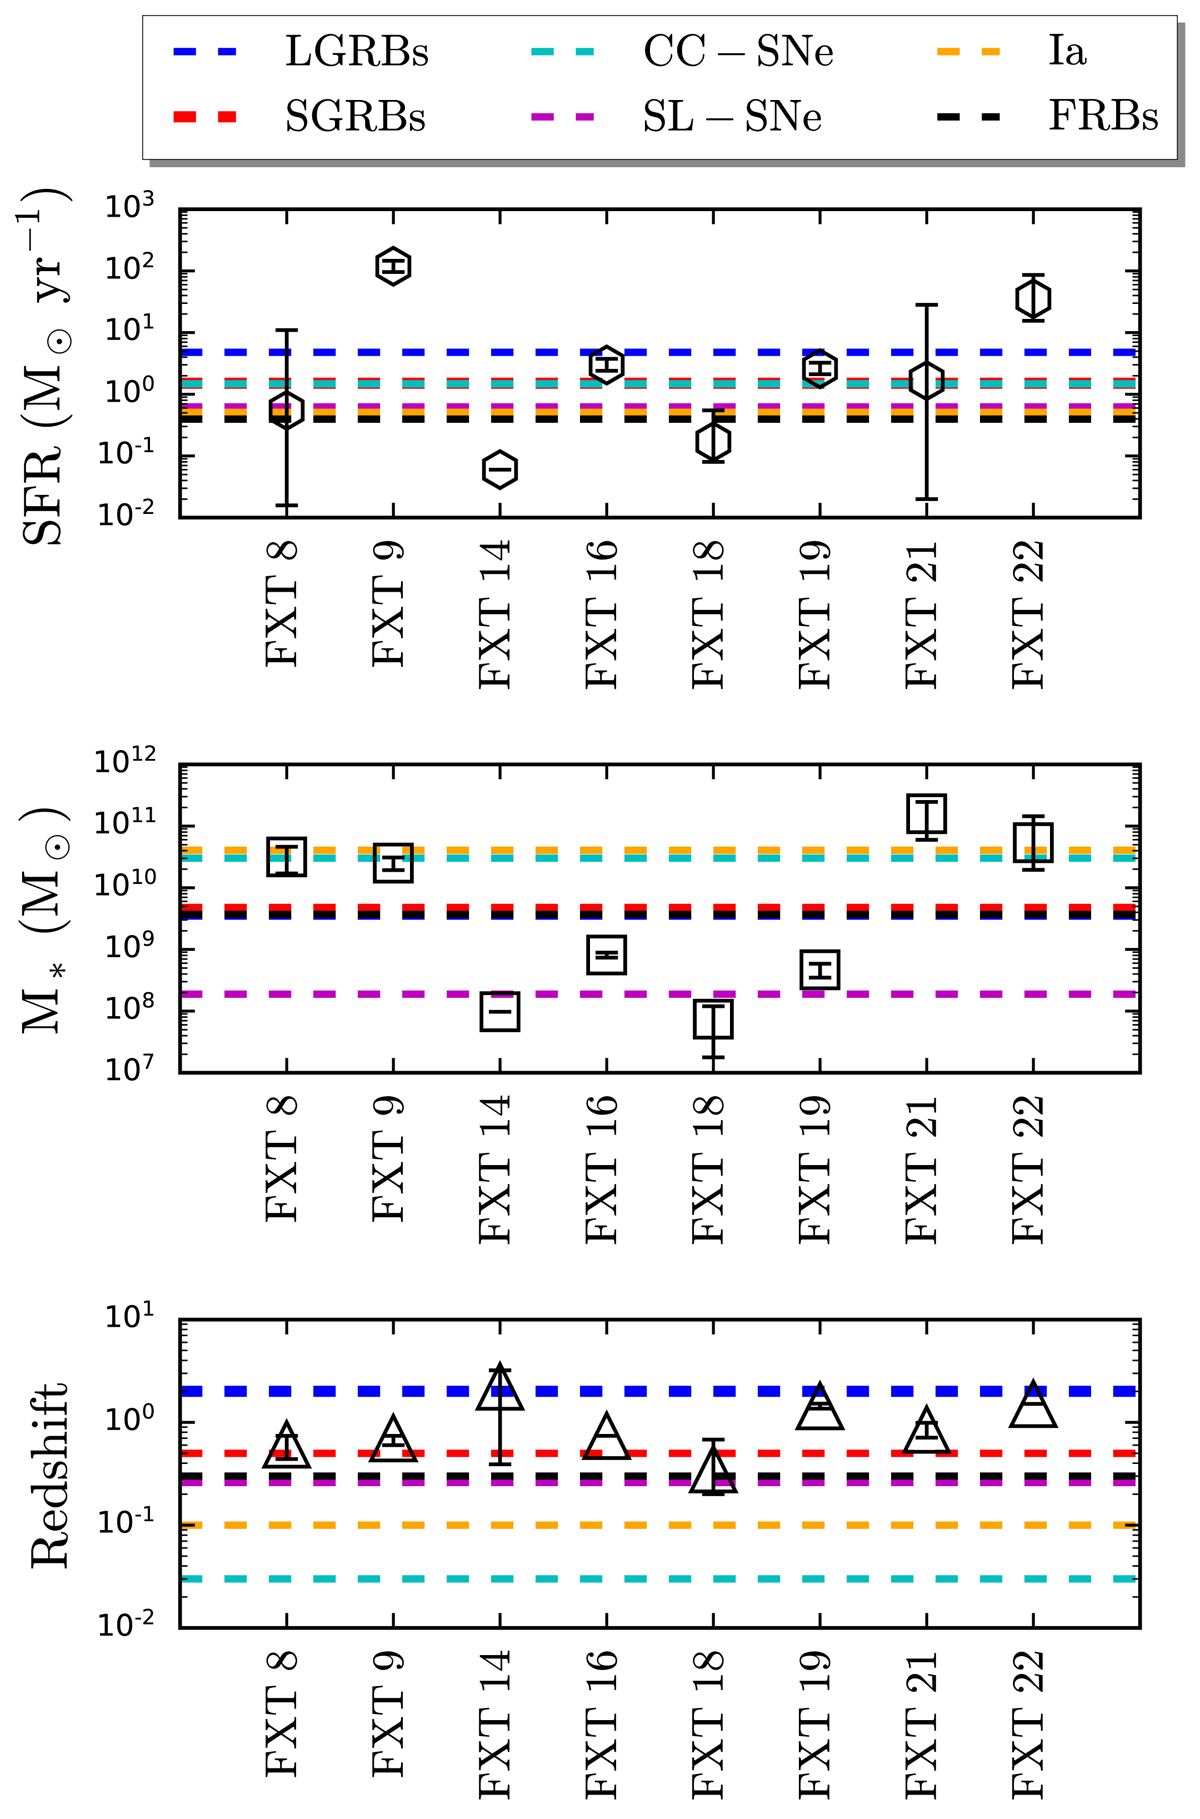
Fig. D.2.
Download original image
Comparison of the star-formation rates (top panel), stellar masses (middle panel), and redshifts (bottom panel) of FXT hosts identified in Paper I (FXTs 8, 9 and 14) and this work (FXTs 16, 19, 21 and 22). The mean SFRs, stellar masses, and redshifts from samples of LGRBs (dashed blue line), SGRBs (dashed red line), CC- (dashed cyan line), and Type Ia (dashed orange line) SNe, SL-SNe, and FRBs (dashed black line) are also plotted (Tsvetkov & Bartunov 1993; Prieto et al. 2008; Li et al. 2016; Galbany et al. 2014; Blanchard et al. 2016; Heintz et al. 2020; Schulze et al. 2021; Fong et al. 2022; Qin et al. 2022).
Current usage metrics show cumulative count of Article Views (full-text article views including HTML views, PDF and ePub downloads, according to the available data) and Abstracts Views on Vision4Press platform.
Data correspond to usage on the plateform after 2015. The current usage metrics is available 48-96 hours after online publication and is updated daily on week days.
Initial download of the metrics may take a while.