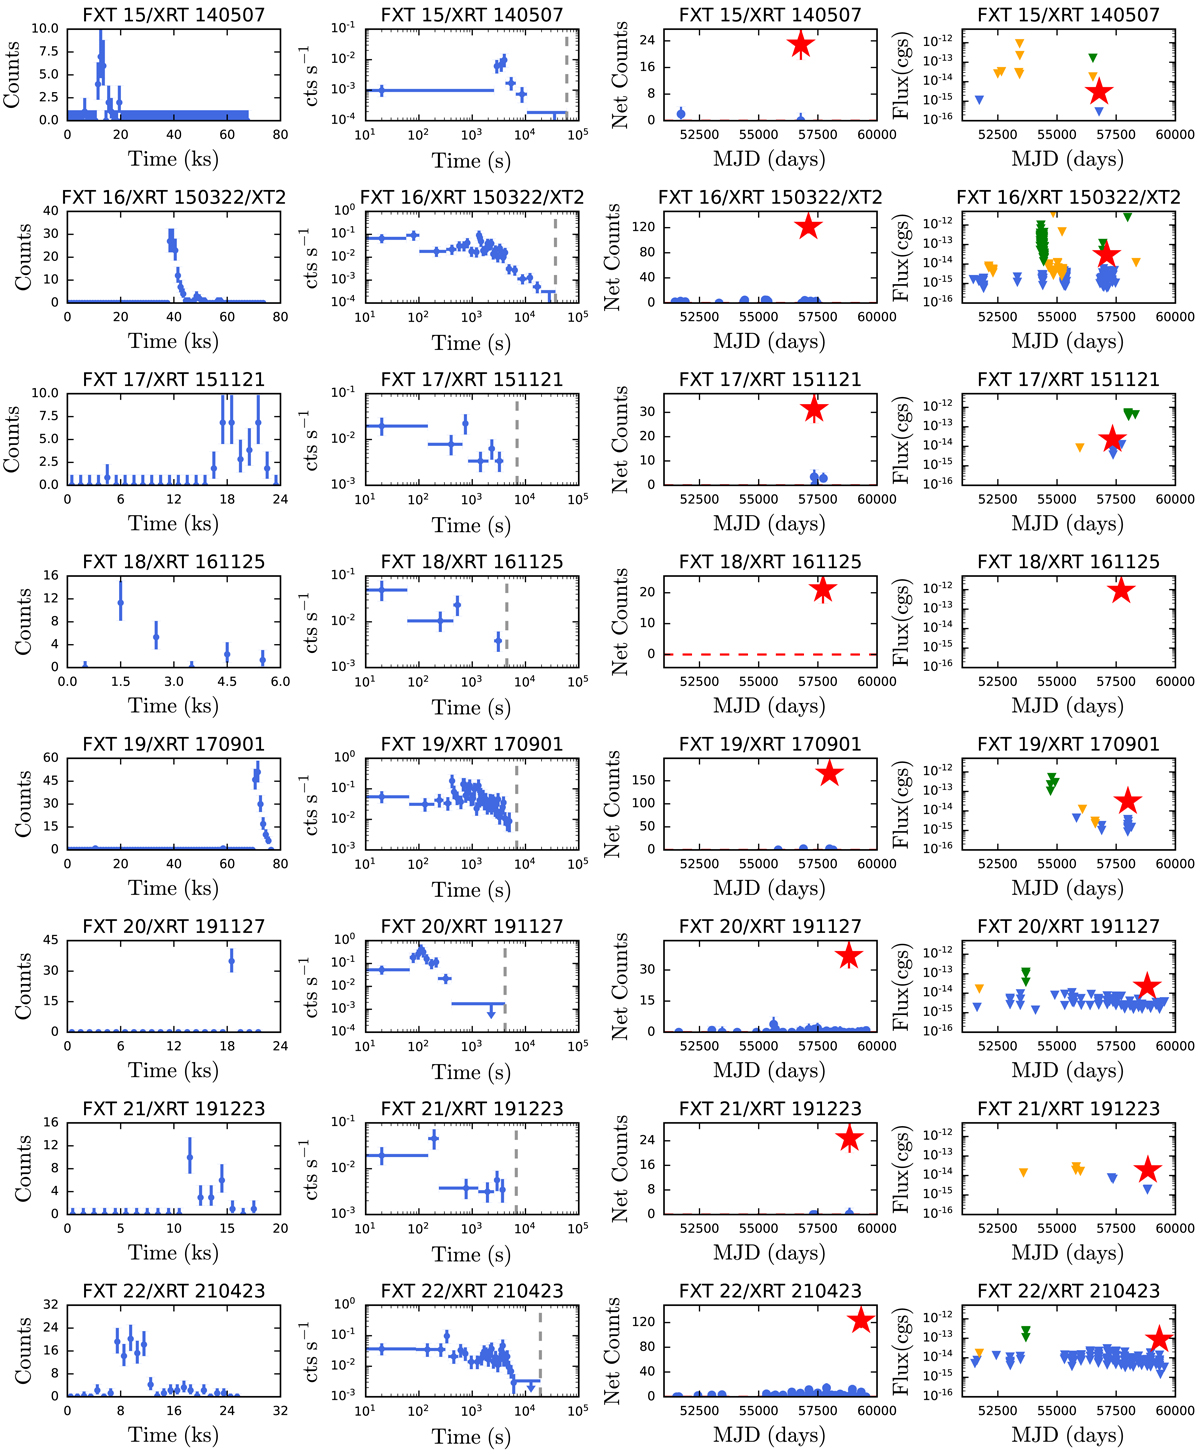
Fig. 3.
Download original image
0.5–7 keV light curves for each FXT candidate: (1st column) full exposure, in units of counts; (2nd column) zoom in, from the detection of first photon to the end of the exposure, in units of count rate (cts s−1), with log-log scaling and 5 counts per bin. The gray dashed lines show the stop-time per observation regarding the beginning of the transient; (3rd column) long-term light curve, with each point representing individual Chandra exposures (cyan circles with 1-σ error bars) to highlight the significance of detections and nondetections, in units of counts; (4th column) long-term light curve, with each point representing individual Chandra (cyan), XMM-Newton (orange) and Swift-XRT (green) exposures in units of flux (erg s−1 cm−2). For the long-term light curves, the observation including the transient is denoted by a large red star (1-σ error bars), while triangles denote observations with (3-σ) upper limits. All fluxes are reported in the 0.5–7 keV band in the observer’s frame.
Current usage metrics show cumulative count of Article Views (full-text article views including HTML views, PDF and ePub downloads, according to the available data) and Abstracts Views on Vision4Press platform.
Data correspond to usage on the plateform after 2015. The current usage metrics is available 48-96 hours after online publication and is updated daily on week days.
Initial download of the metrics may take a while.