Open Access
Fig. 9
Download original image
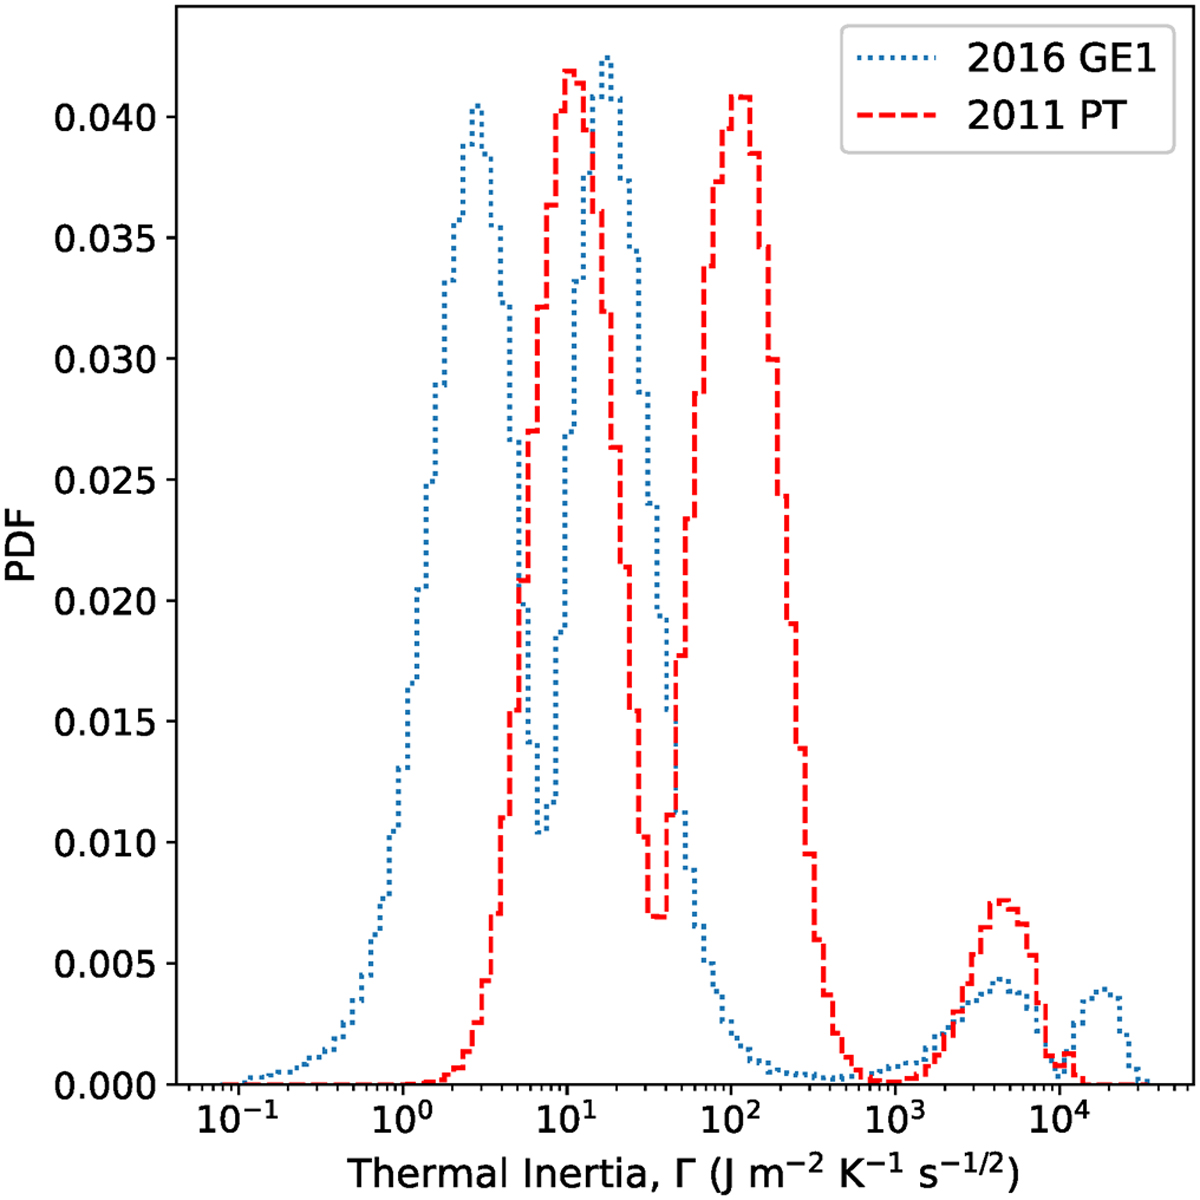
Comparative distributions of thermal inertia for the NEAs 2016 GE1 (dotted blue line) and 2011 PT (dashed red line). In both cases, the results were obtained with the eccentric Yarkovsky model and a heat capacity of C = 600 J kg−1 K−1.
Current usage metrics show cumulative count of Article Views (full-text article views including HTML views, PDF and ePub downloads, according to the available data) and Abstracts Views on Vision4Press platform.
Data correspond to usage on the plateform after 2015. The current usage metrics is available 48-96 hours after online publication and is updated daily on week days.
Initial download of the metrics may take a while.