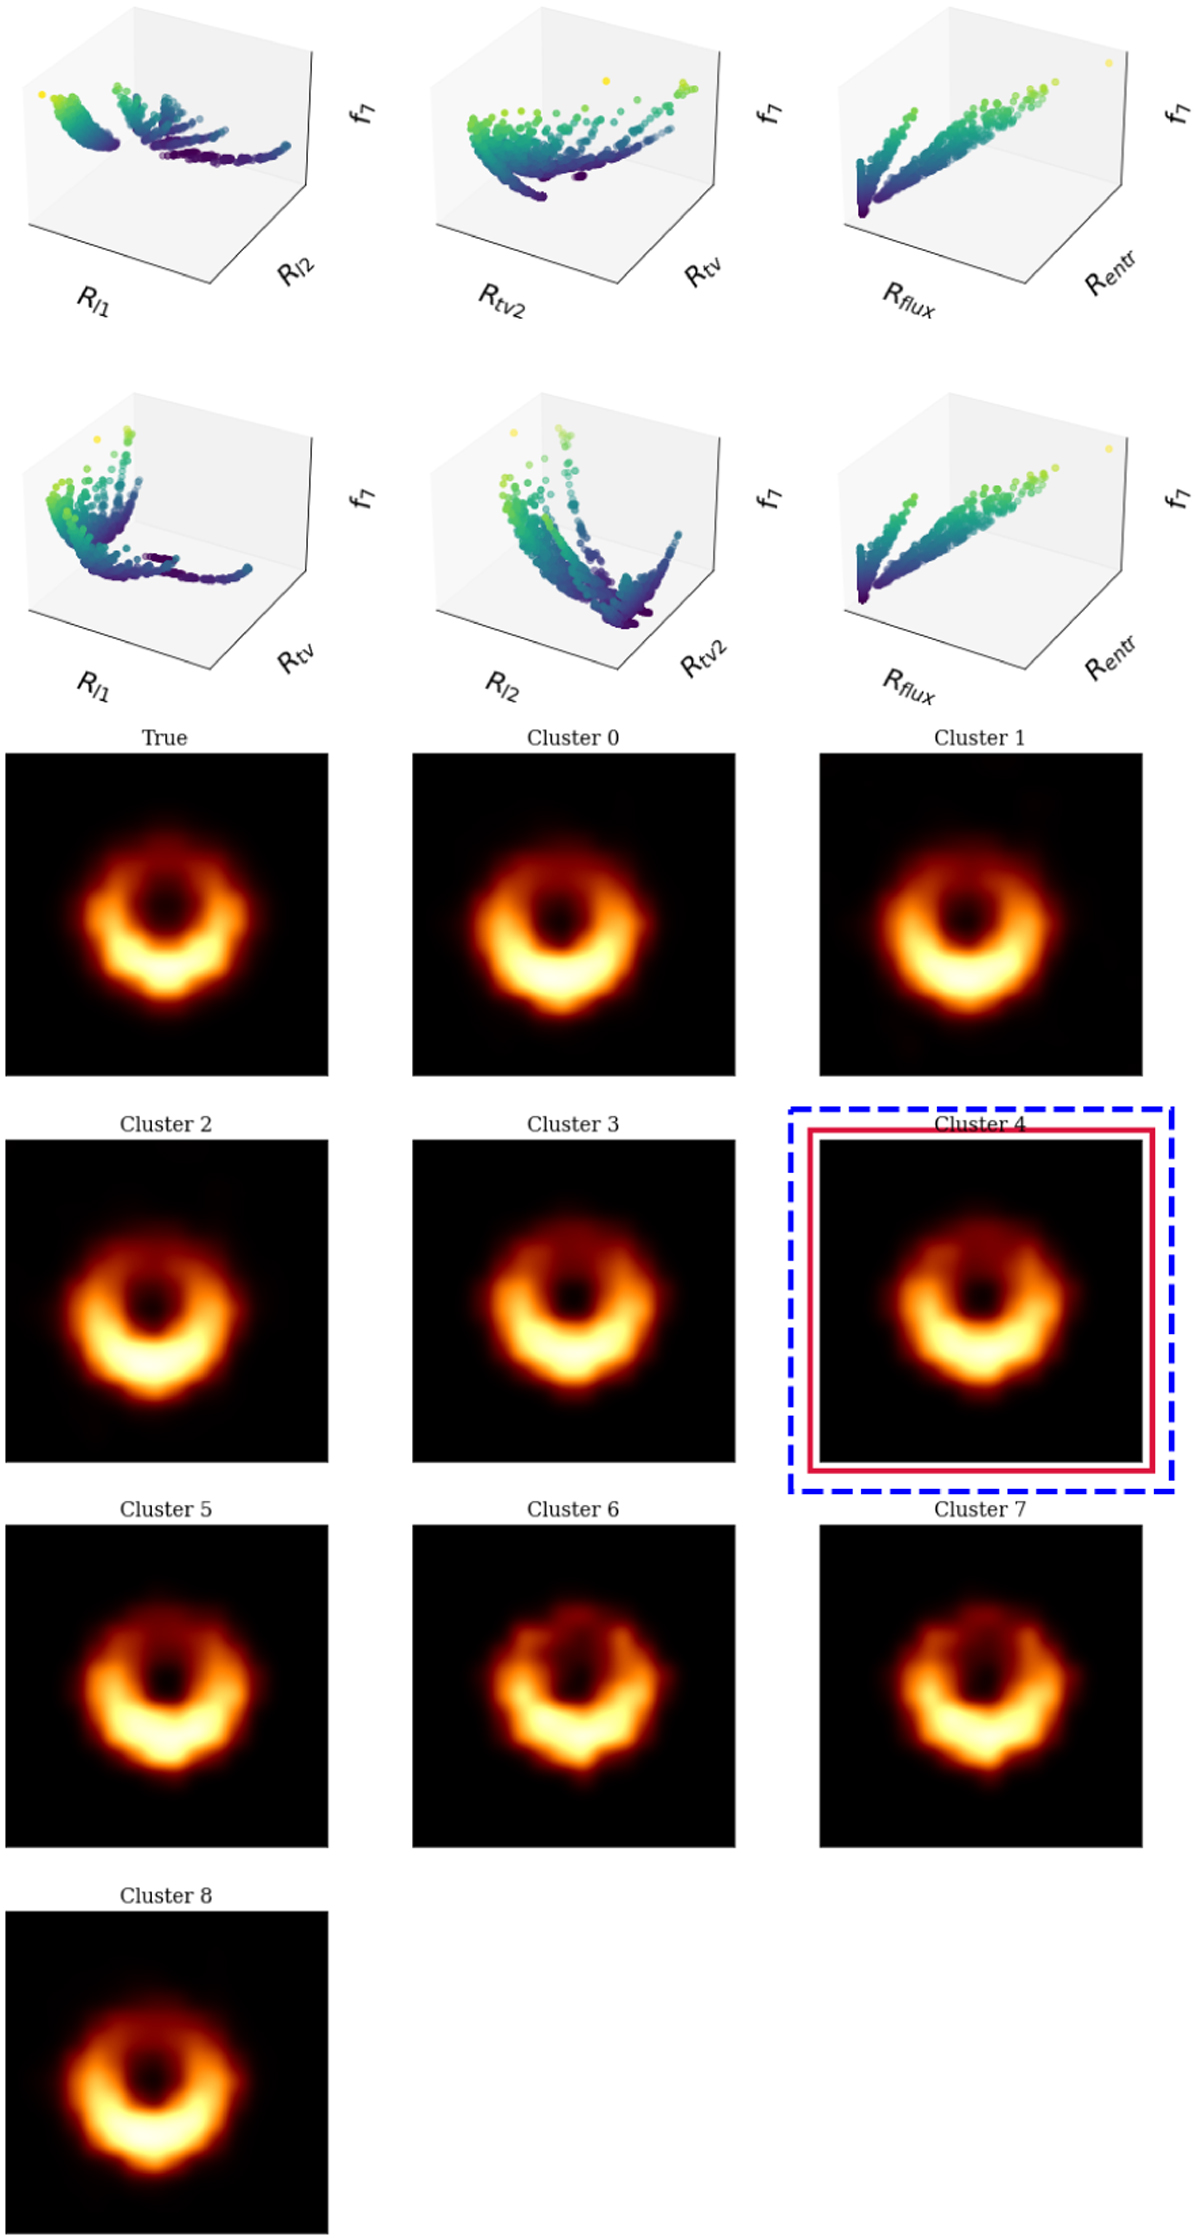
Fig. 3
Download original image
Solution space of the MOEA/D. First two rows: Pareto front for the crescent case using the EHT + ngEHT array. The first panel of the solution clusters (top-left corner) shows the true image. The Pareto front is a seven-dimensional hypersurface. We illustrate the Pareto front with six projections. The six projections show the correlation between two regularizers and their values with respect to f7 (data fidelity term, only functional). The bluer the points are, the lower the value for f7. Bottom two rows: solution clusters (following rows) for the crescent case using the EHT + ngEHT array. The family of solutions can be grouped into eight clusters. The red box surrounding the cluster indicates the preferred solution by the accumulation point strategy, while the blue box is the solution closest to the ideal.
Current usage metrics show cumulative count of Article Views (full-text article views including HTML views, PDF and ePub downloads, according to the available data) and Abstracts Views on Vision4Press platform.
Data correspond to usage on the plateform after 2015. The current usage metrics is available 48-96 hours after online publication and is updated daily on week days.
Initial download of the metrics may take a while.