Open Access
Fig. 7
Download original image
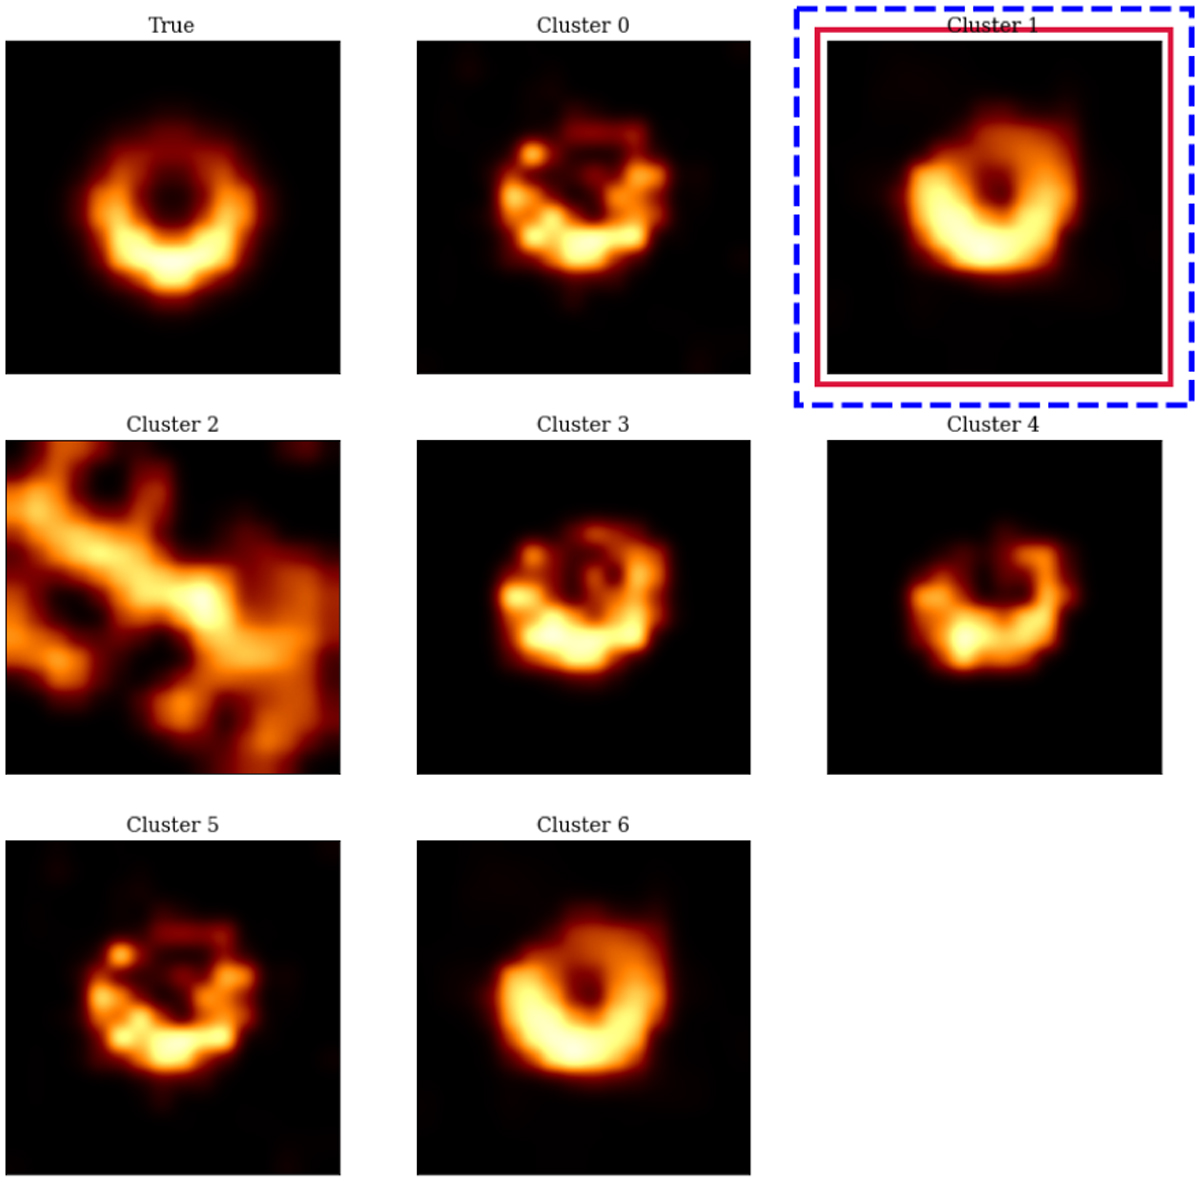
Solution clusters for the crescent case using the EHT array. The first panel (top-left corner) shows the true image. The red box surrounds the cluster indicated by the accumulation point strategy, while the blue box highlights the cluster closest to the ideal.
Current usage metrics show cumulative count of Article Views (full-text article views including HTML views, PDF and ePub downloads, according to the available data) and Abstracts Views on Vision4Press platform.
Data correspond to usage on the plateform after 2015. The current usage metrics is available 48-96 hours after online publication and is updated daily on week days.
Initial download of the metrics may take a while.