Fig. 8.
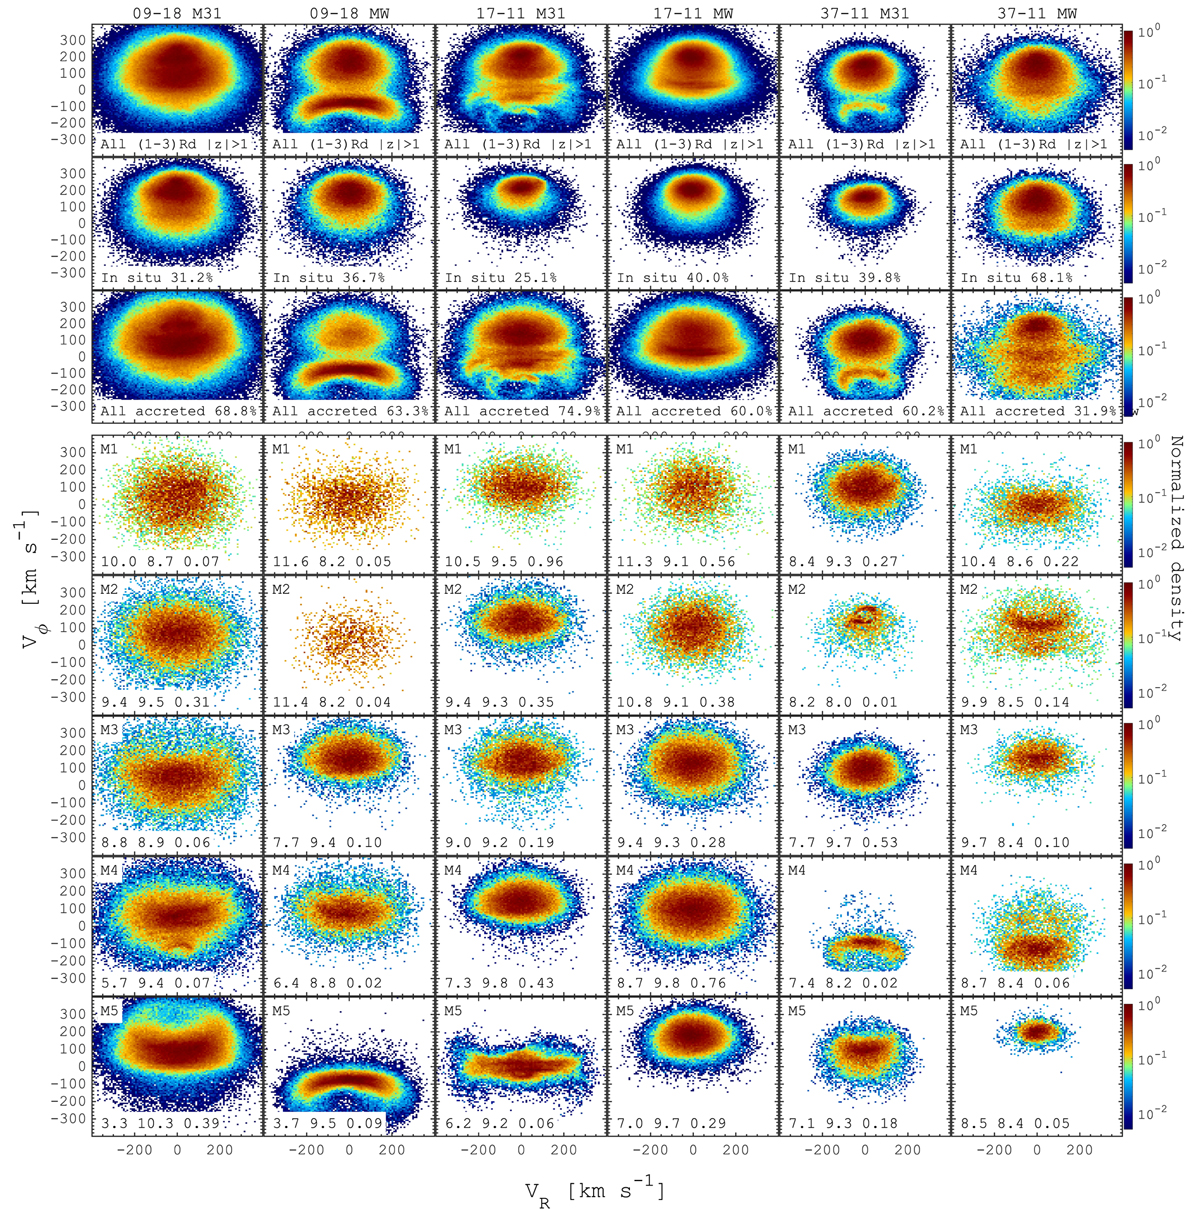
Download original image
Kinematic structure of the stellar haloes. Top three rows: Stellar density distributions in the VR − Vϕ plane at redshift zero for stars in the range (1 − 3)Rd (where Rd is the disc scale-length from Libeskind et al. 2020) and |z|> 1 kpc including all stars (first row), only in situ stars (second row), and only accreted populations (third row). The mass fractions of the in situ and accreted populations are shown at the bottom of the second and third rows, respectively. Bottom five rows: As above, but for the five most significant mergers at z = 0 (M1–M5; see Fig. 4 in Paper I). The merger accretion lookback time (Gyr), the total stellar mass of the merger debris at the time of the merger (log10(M*/M⊙)), and the stellar mass ratio (μ*) relative to the main M31/MW progenitor at the time of the merger are given at the bottom of each panel. The colour bar represents a normalized density relative to the maximum value. All M31/MW HESTIA galaxies demonstrate the presence of Gaia-Sausage-like features, which exhibit different individual shapes and radial velocity ranges.
Current usage metrics show cumulative count of Article Views (full-text article views including HTML views, PDF and ePub downloads, according to the available data) and Abstracts Views on Vision4Press platform.
Data correspond to usage on the plateform after 2015. The current usage metrics is available 48-96 hours after online publication and is updated daily on week days.
Initial download of the metrics may take a while.