Fig. A.1.
Download original image
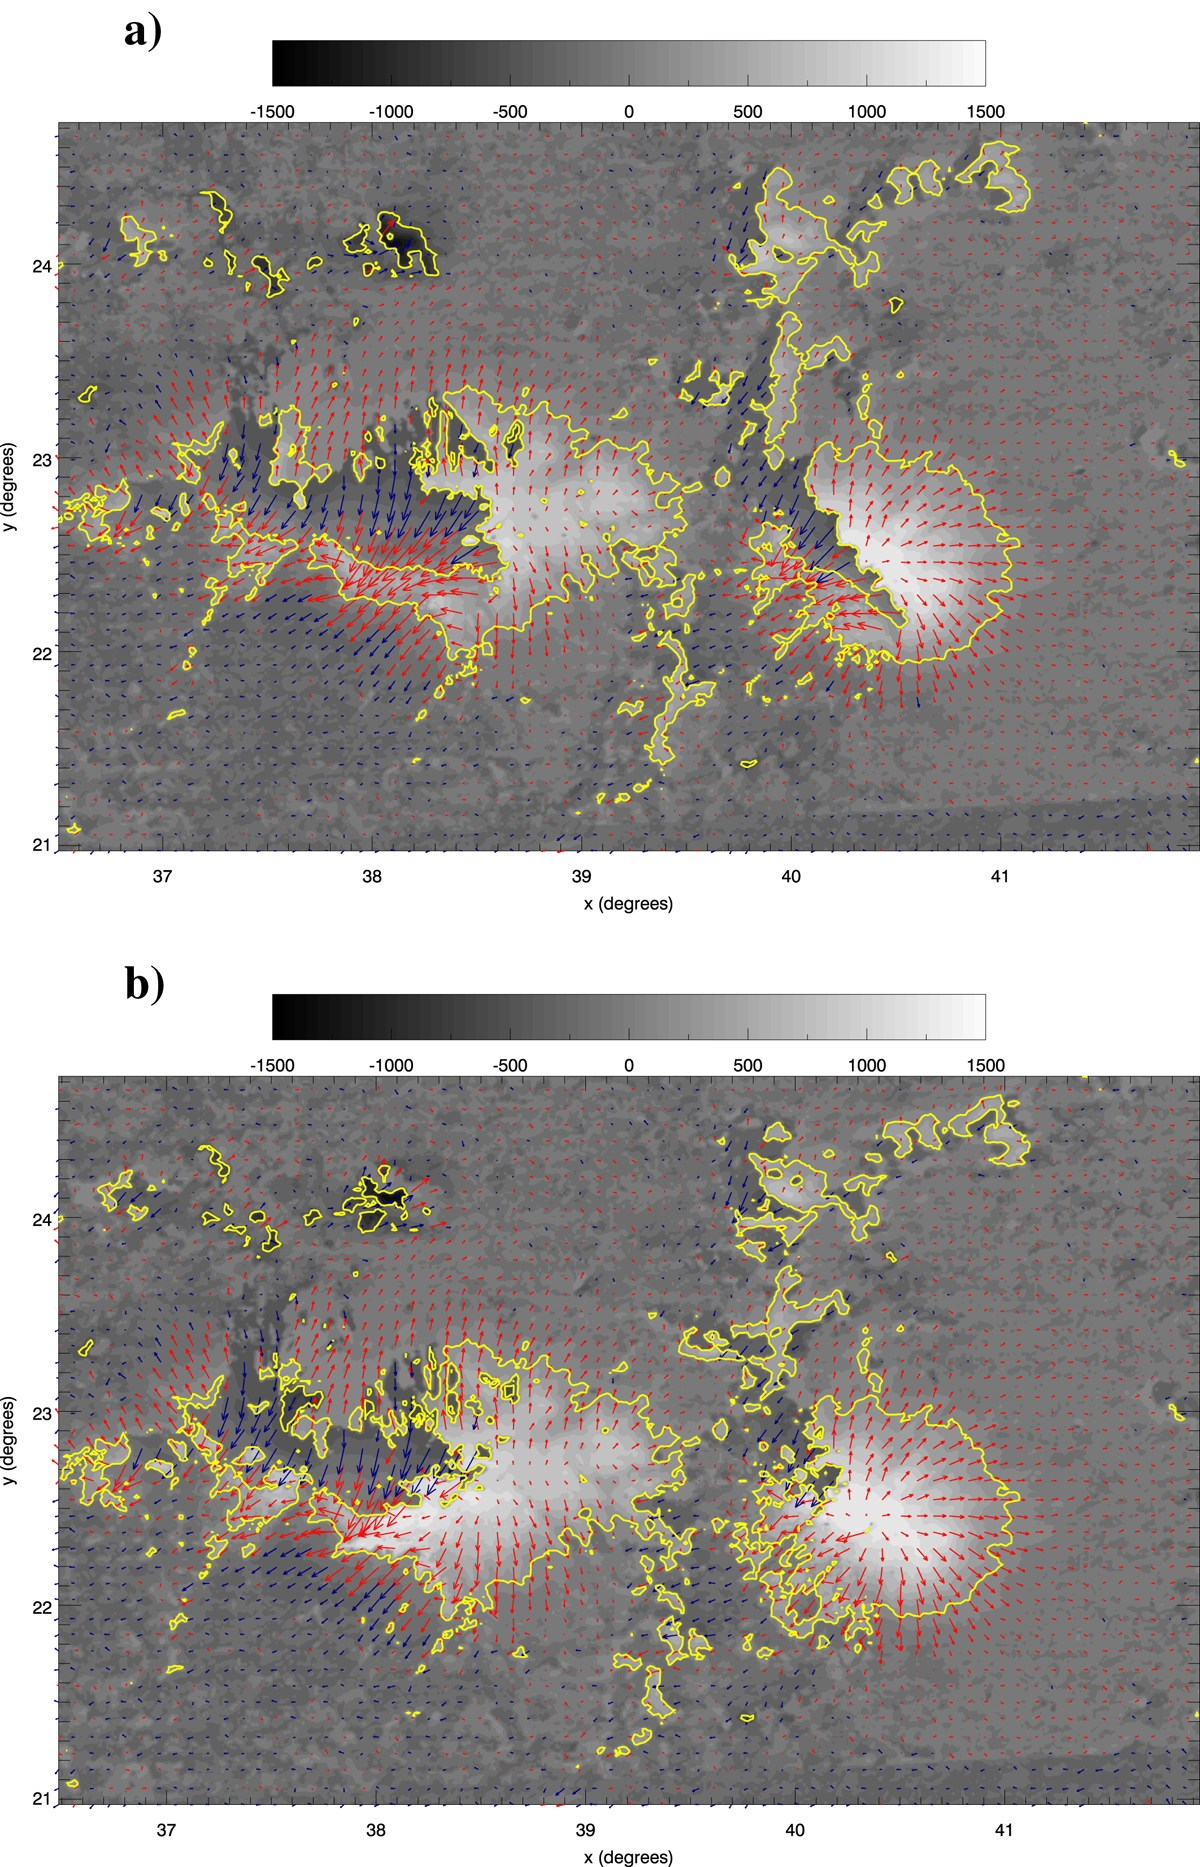
SDM-disambiguated vector magnetograms remapped in Stonyhurst coordinates, with the magnetic field re-projected in radial, poloidal, and toroidal components, corresponding to the cases in Fig. 8b and Fig. 9b, respectively. In both panels, the background image represents the radial component Br saturated at ±1500 G in grayscale, and red and blue arrows represent the horizontal field at positive and negative Br, respectively. The 400 G isoline of |Br| is drawn as a solid yellow line.
Current usage metrics show cumulative count of Article Views (full-text article views including HTML views, PDF and ePub downloads, according to the available data) and Abstracts Views on Vision4Press platform.
Data correspond to usage on the plateform after 2015. The current usage metrics is available 48-96 hours after online publication and is updated daily on week days.
Initial download of the metrics may take a while.