Fig. 2.
Download original image
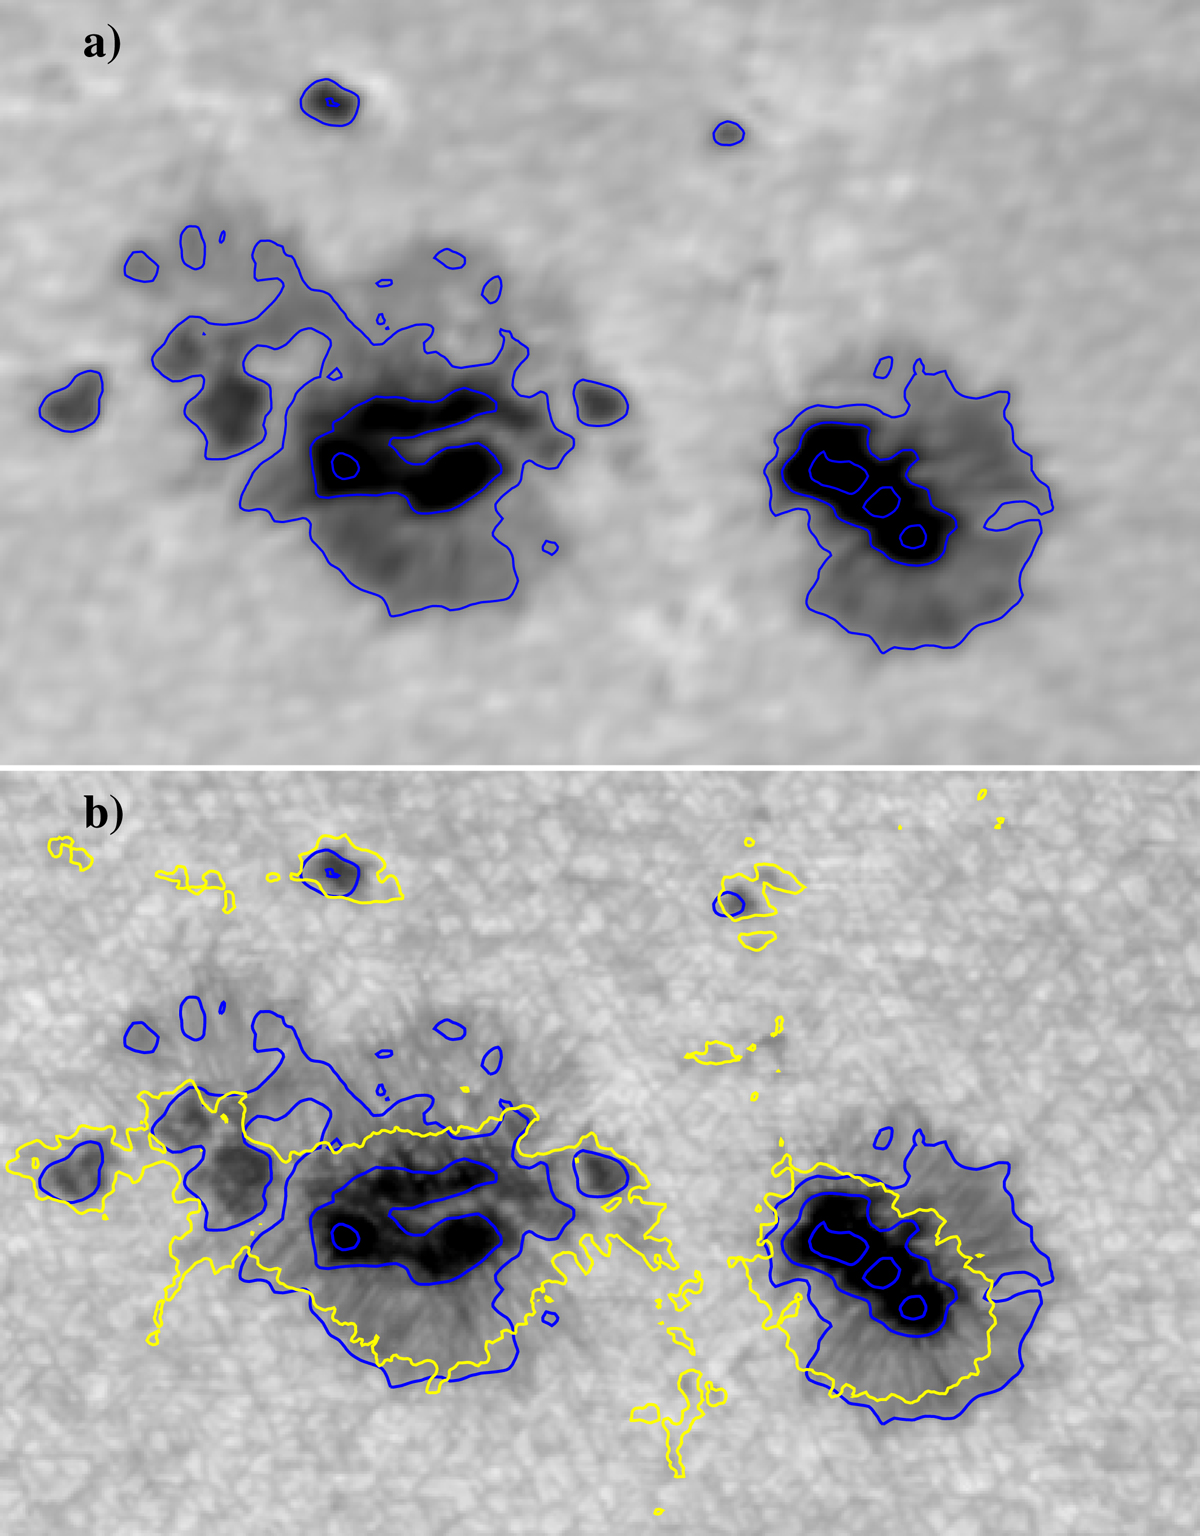
Continuum images on the SO/PHI-HRT image plane of (a) remapped SDO/HMI and (b) SO/PHI-HRT data sets. The continuum intensity is normalized by its median value and shown between 0.5 and 1.2. In both panels, the isocontours of the SDO/HMI continuum intensity at [15.,25.,35.] × 103 DN s−1 (corresponding to [0.37, 0.62, 0.86] in normalized units) are drawn as solid blue lines. In panel b, the 400 G isoline of the SO/PHI-HRT |Blos| is drawn as a solid yellow line.
Current usage metrics show cumulative count of Article Views (full-text article views including HTML views, PDF and ePub downloads, according to the available data) and Abstracts Views on Vision4Press platform.
Data correspond to usage on the plateform after 2015. The current usage metrics is available 48-96 hours after online publication and is updated daily on week days.
Initial download of the metrics may take a while.