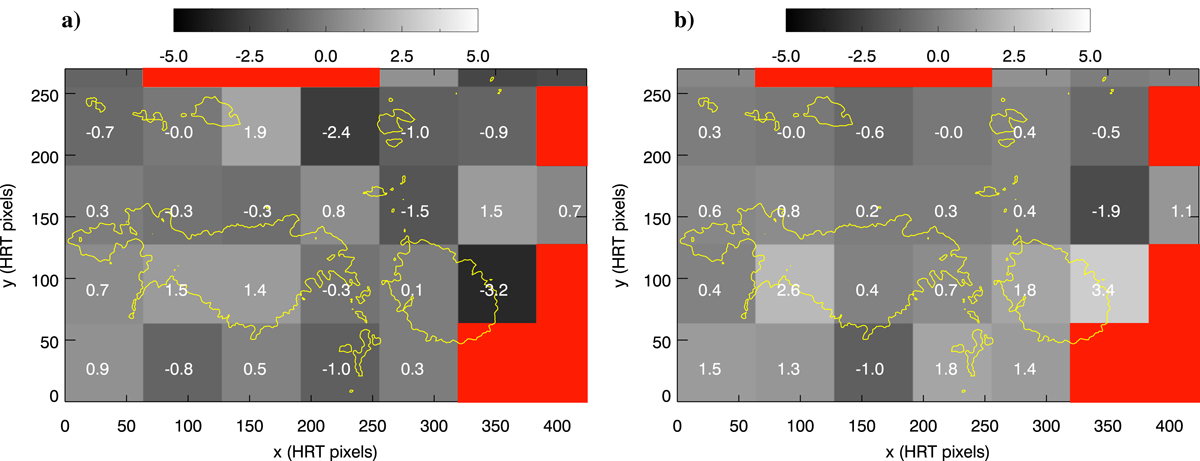
Fig. 3.
Download original image
Residual cross-correlation shifts after co-registration, computed in tiles of 64 × 64 pixels, in the x (panel a) and y direction (panel b). The number at the center of each tile is the co-registration shift for that tile, in units of SO/PHI-HRT pixels. Tiles where the cross-correlation procedure did not converge are marked in red. In both panels, the 400 G isoline of the SO/PHI-HRT |Blos| is drawn as a solid yellow line.
Current usage metrics show cumulative count of Article Views (full-text article views including HTML views, PDF and ePub downloads, according to the available data) and Abstracts Views on Vision4Press platform.
Data correspond to usage on the plateform after 2015. The current usage metrics is available 48-96 hours after online publication and is updated daily on week days.
Initial download of the metrics may take a while.