Fig. 5.
Download original image
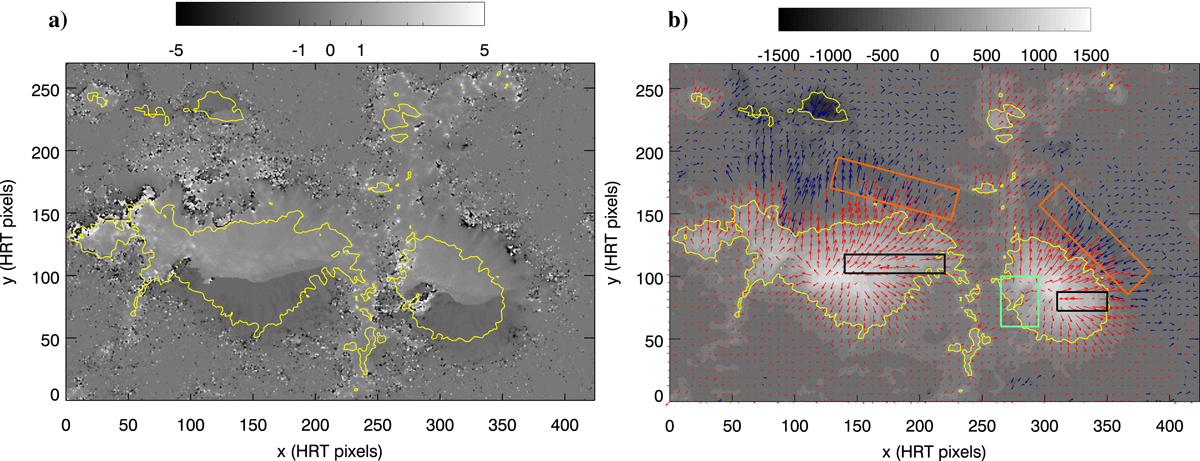
Application of the SDM using the hmi.ME_720s_fd10 series and Eq. (5). Panel a: sign function ζ saturated at ±5. Panel b: corresponding SDM-disambiguated vector magnetogram, with Blos saturated at ±1500 G in grayscale and red and blue arrows representing the transverse field at positive and negative Blos (same as Fig. 4a). The rectangles in panel b indicate the areas of suspicious disambiguations discussed in Sect. 4.2 (black) and Sect. 4.2.1 (orange and green). In both panels, the 400 G isoline of the SO/PHI-HRT |Blos| is drawn as a solid yellow line.
Current usage metrics show cumulative count of Article Views (full-text article views including HTML views, PDF and ePub downloads, according to the available data) and Abstracts Views on Vision4Press platform.
Data correspond to usage on the plateform after 2015. The current usage metrics is available 48-96 hours after online publication and is updated daily on week days.
Initial download of the metrics may take a while.