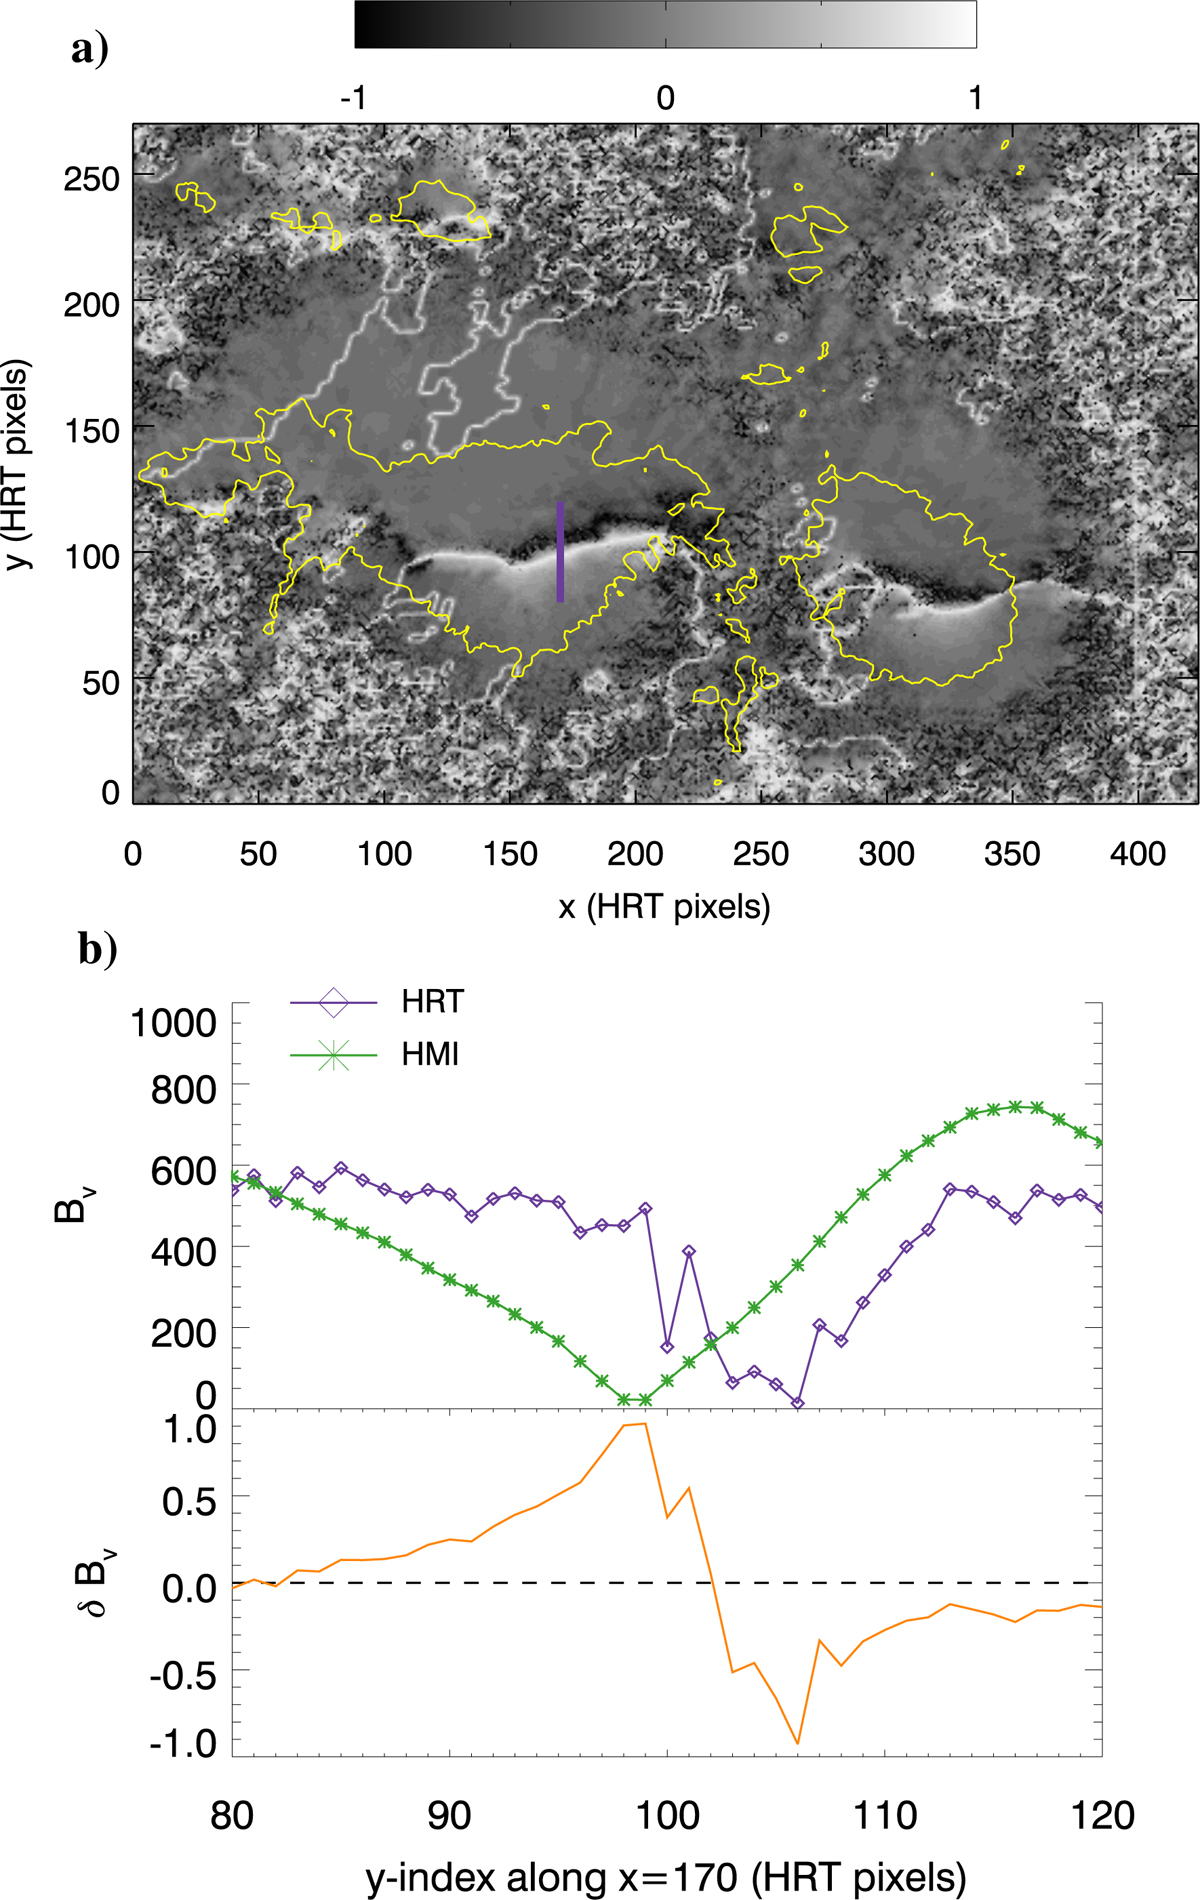
Fig. 6.
Download original image
Relative difference, δBv, on the SO/PHI-HRT image plane (see Eq. (7)). Panel a: spatial distribution of δBv. The 400 G isoline of the SO/PHI-HRT |Blos| is drawn as a solid yellow line; the purple slit at x = 170 corresponds to the location of the one-dimensional plot in panel b. Panel b, upper: profiles of the Bv components along the purple slit in panel a, for the remapped SDO/HMI (green) and SO/PHI-HRT (purple). Panel b, lower: corresponding δBv along the purple slit in panel a.
Current usage metrics show cumulative count of Article Views (full-text article views including HTML views, PDF and ePub downloads, according to the available data) and Abstracts Views on Vision4Press platform.
Data correspond to usage on the plateform after 2015. The current usage metrics is available 48-96 hours after online publication and is updated daily on week days.
Initial download of the metrics may take a while.