Fig. 2.
Download original image
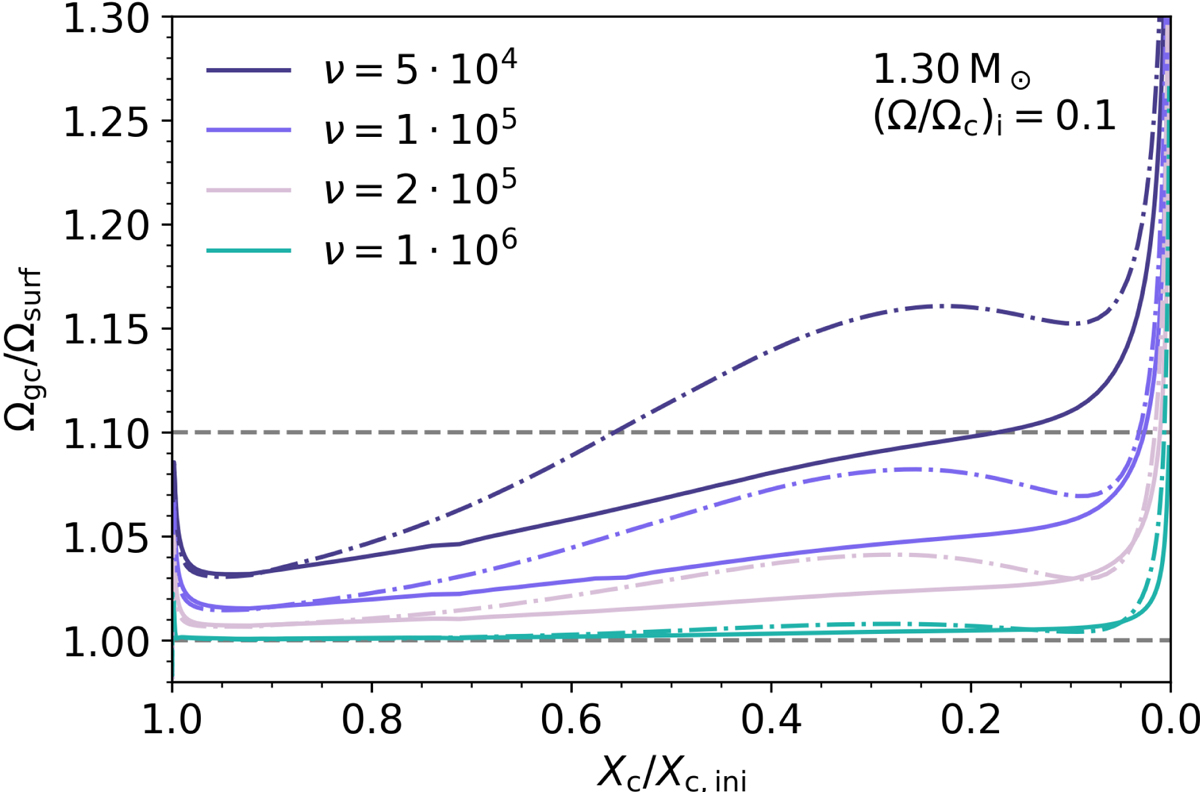
Predicted ratio of the g-mode cavity rotation frequency over the surface rotation frequency accumulated across evolution for a 1.3 M⊙ model starting with (Ω/Ωc)i = 0.1. In these models, AM transport is modelled by a constant uniform viscosity, which is shown in the legend (in cm2 s−1). The solid lines are for fov = 0.005, and the dashed-dotted lines for fov = 0.035. The typical upper limit of the observed range of core-to-surface rotation is shown by the upper horizontal grey dashed line. The lower grey dashed horizontal line indicates solid body rotation.
Current usage metrics show cumulative count of Article Views (full-text article views including HTML views, PDF and ePub downloads, according to the available data) and Abstracts Views on Vision4Press platform.
Data correspond to usage on the plateform after 2015. The current usage metrics is available 48-96 hours after online publication and is updated daily on week days.
Initial download of the metrics may take a while.