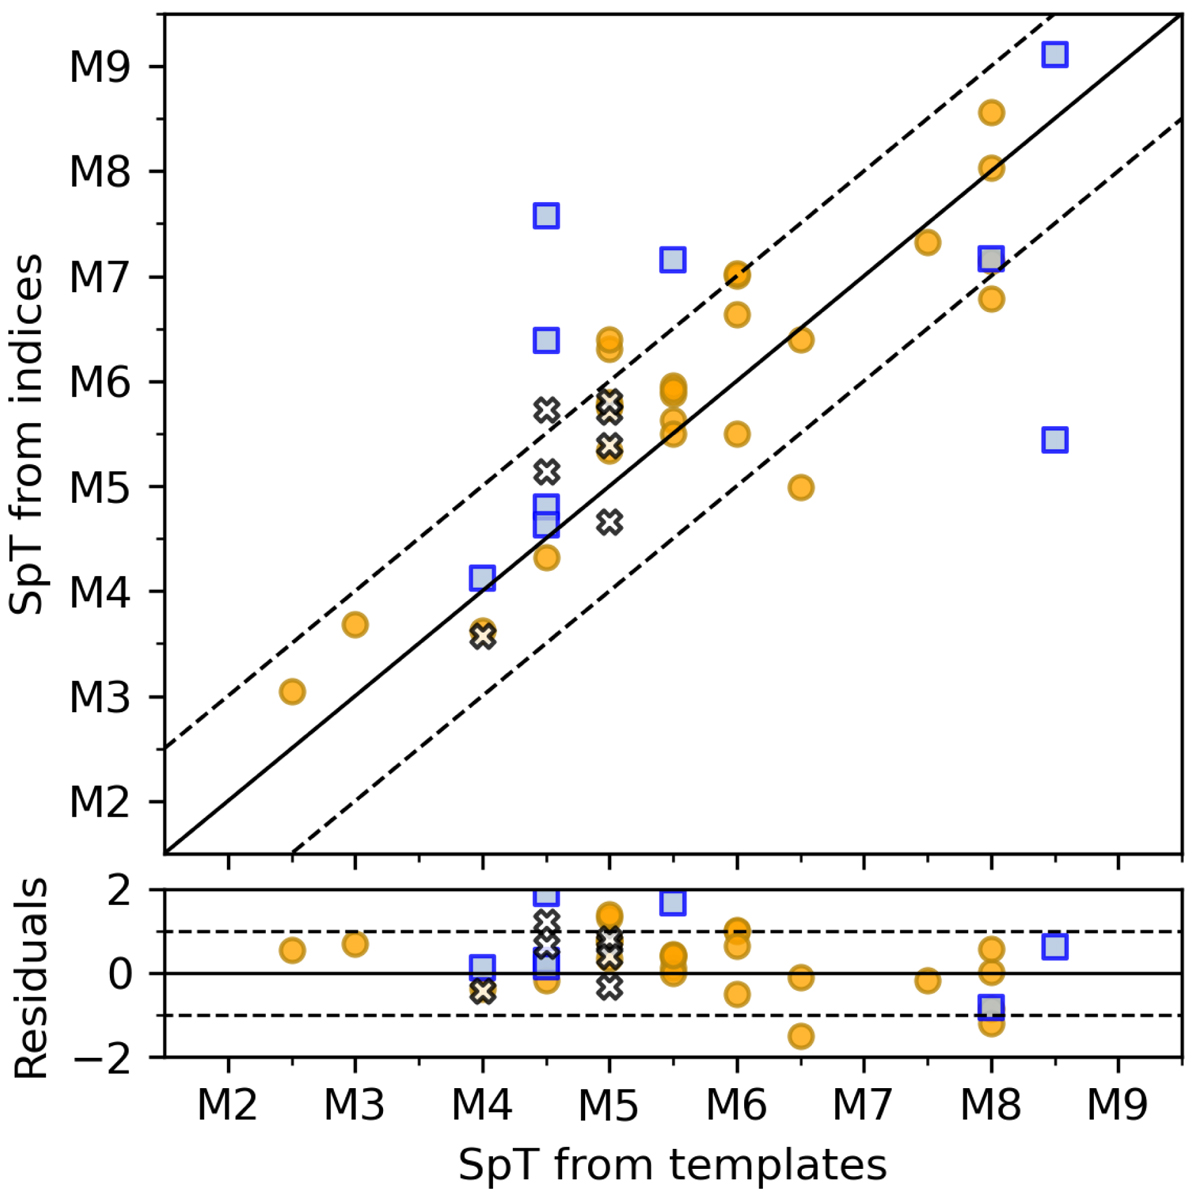
Fig. 5.
Download original image
Comparison of the spectral templates best fit SpT (Sect. 3.1.2) with the SpT coming from spectral indices (Sect. 3.3). The objects are color-coded based on the final membership discussed in Sect. 3.1.4: members (orange circles), possible members (blue squares) and nonmembers (black crosses). The solid line represents the 1:1 SpT relationship, and the dashed lines represent a ±1 SpT deviation from the 1:1 relationship.
Current usage metrics show cumulative count of Article Views (full-text article views including HTML views, PDF and ePub downloads, according to the available data) and Abstracts Views on Vision4Press platform.
Data correspond to usage on the plateform after 2015. The current usage metrics is available 48-96 hours after online publication and is updated daily on week days.
Initial download of the metrics may take a while.