Fig. 8
Download original image
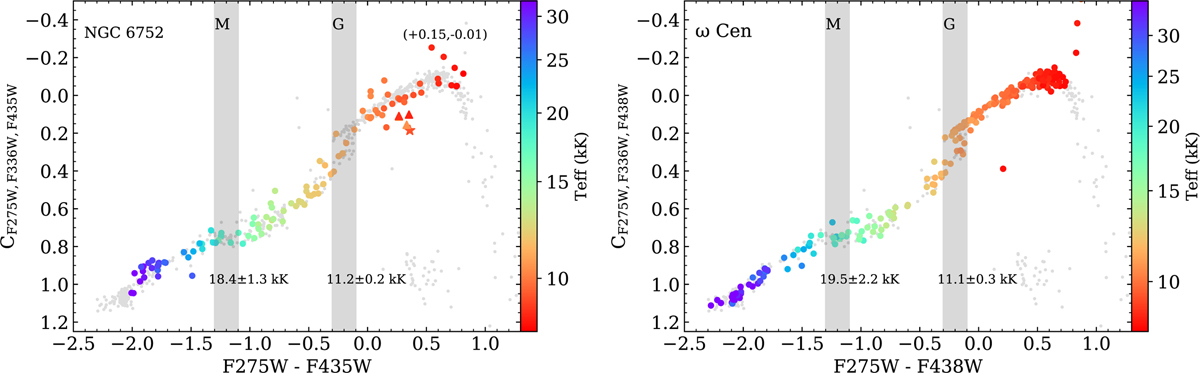
Color-color plot of the HB stars in our samples. The effective temperatures obtained from the spectral fits are color coded. The positions of the G- and M-jumps are indicated by shaded areas, and we indicate the average temperature and standard deviation of the stars that are included in the areas of the jumps. Three hot BSSs (triangle) and V17 (star) in NGC 6752 are also included. We note that some stars are missing in this plot because they do not have a magnitude in all three filters. For both clusters, we plotted the position of the stars from the photometric catalog of ω Cen as small grey dots. For NGC 6752, we also indicate the shift applied to align the stars with those of ω Cen.
Current usage metrics show cumulative count of Article Views (full-text article views including HTML views, PDF and ePub downloads, according to the available data) and Abstracts Views on Vision4Press platform.
Data correspond to usage on the plateform after 2015. The current usage metrics is available 48-96 hours after online publication and is updated daily on week days.
Initial download of the metrics may take a while.