Fig. 4
Download original image
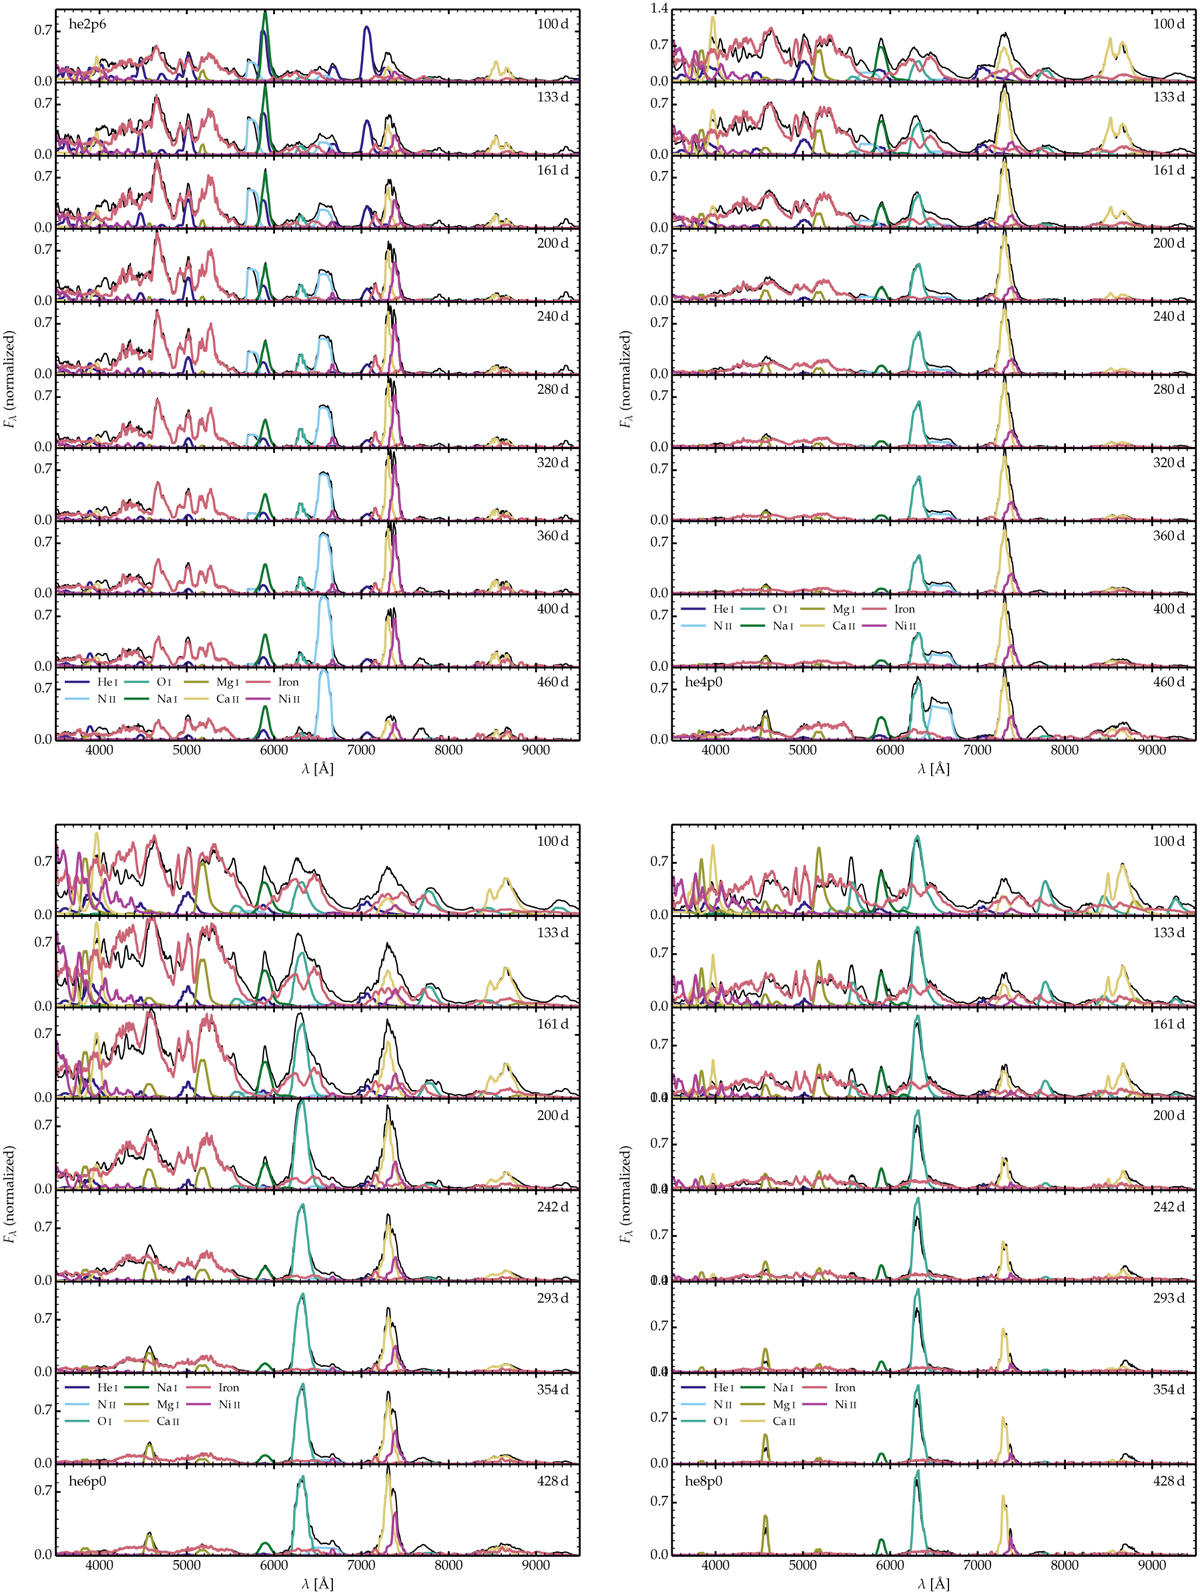
Evolution of the optical spectrum of models he2p6 (top left), he4p0 (top right), he6p0 (bottom left), and he8p0 (bottom right) from 100 to about 450 days (black). Also plotted is the contribution from bound-bound transitions associated with various ions (“iron” corresponds to a simulation of the spectrum that includes all Fe I, Fe II, and Fe III bound-bound transitions) – these individual contributions dominate in turn in distinct spectral regions so that the black line giving the total flux, which is exclusively an emission line spectrum, is hardly visible at any epoch. [N II] λλ 6548, 6583 dominates the emission near 6500 Å in he2p6, is present in he4p0 at later epochs, but absent in the higher pre-SN mass models. In the latter two models, [O I] λλ 6300, 6364 is the prominent feature near 6300 Å.
Current usage metrics show cumulative count of Article Views (full-text article views including HTML views, PDF and ePub downloads, according to the available data) and Abstracts Views on Vision4Press platform.
Data correspond to usage on the plateform after 2015. The current usage metrics is available 48-96 hours after online publication and is updated daily on week days.
Initial download of the metrics may take a while.