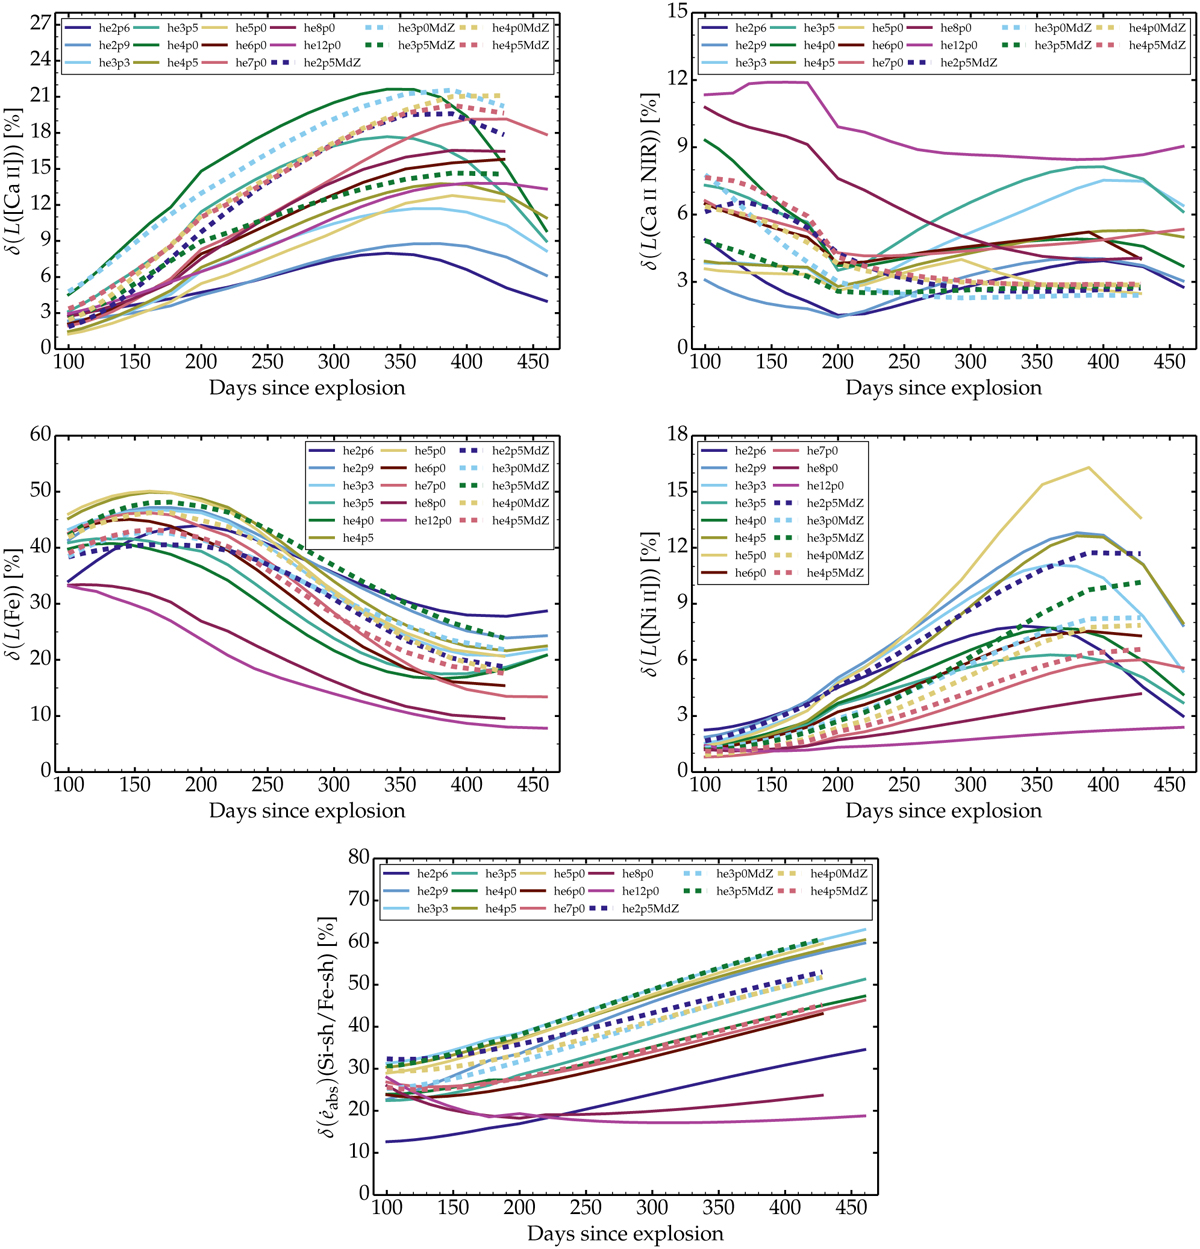
Fig. 7
Download original image
Same as Fig. 5, but showing the fractional flux associated with [Ca II] λλ 7291, 7323 (top left panel), with Ca II λλ 8498 – 8662 (top right panel), with Fe emission in the 4100–5500 Å range (middle left panel), and with [Ni II] λ 7378 (middle right panel), as well as the fractional decay power absorbed in the combined Si-rich and Fe-rich shells (bottom panel).
Current usage metrics show cumulative count of Article Views (full-text article views including HTML views, PDF and ePub downloads, according to the available data) and Abstracts Views on Vision4Press platform.
Data correspond to usage on the plateform after 2015. The current usage metrics is available 48-96 hours after online publication and is updated daily on week days.
Initial download of the metrics may take a while.