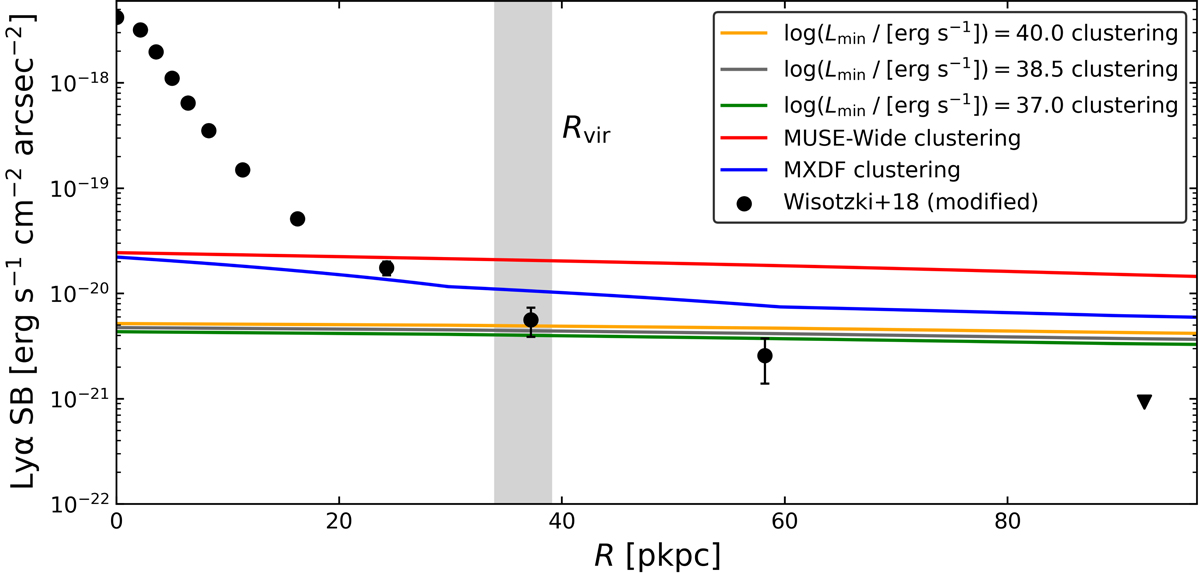
Fig. 5.
Download original image
Contribution to the Lyα SB profiles from clustered and undetected LAEs with log(Lmin/[erg s−1]) = 38.5. Differently colored lines correspond to a different assumption for the clustering of undetected LAEs. Detected galaxies are assumed to cluster like those in the MUSE-Wide sample. The data points correspond to the modified stacking experiment of individual LAEs of Wisotzki et al. (2018; see Sects. 2 and 4.4). The triangle denotes an upper limit. We employ a pseudo-NB width of 600 km s−1 and the Lyα LF of Herenz et al. (2019). The shaded gray region shows the typical virial radius of MUSE-Wide LAEs.
Current usage metrics show cumulative count of Article Views (full-text article views including HTML views, PDF and ePub downloads, according to the available data) and Abstracts Views on Vision4Press platform.
Data correspond to usage on the plateform after 2015. The current usage metrics is available 48-96 hours after online publication and is updated daily on week days.
Initial download of the metrics may take a while.