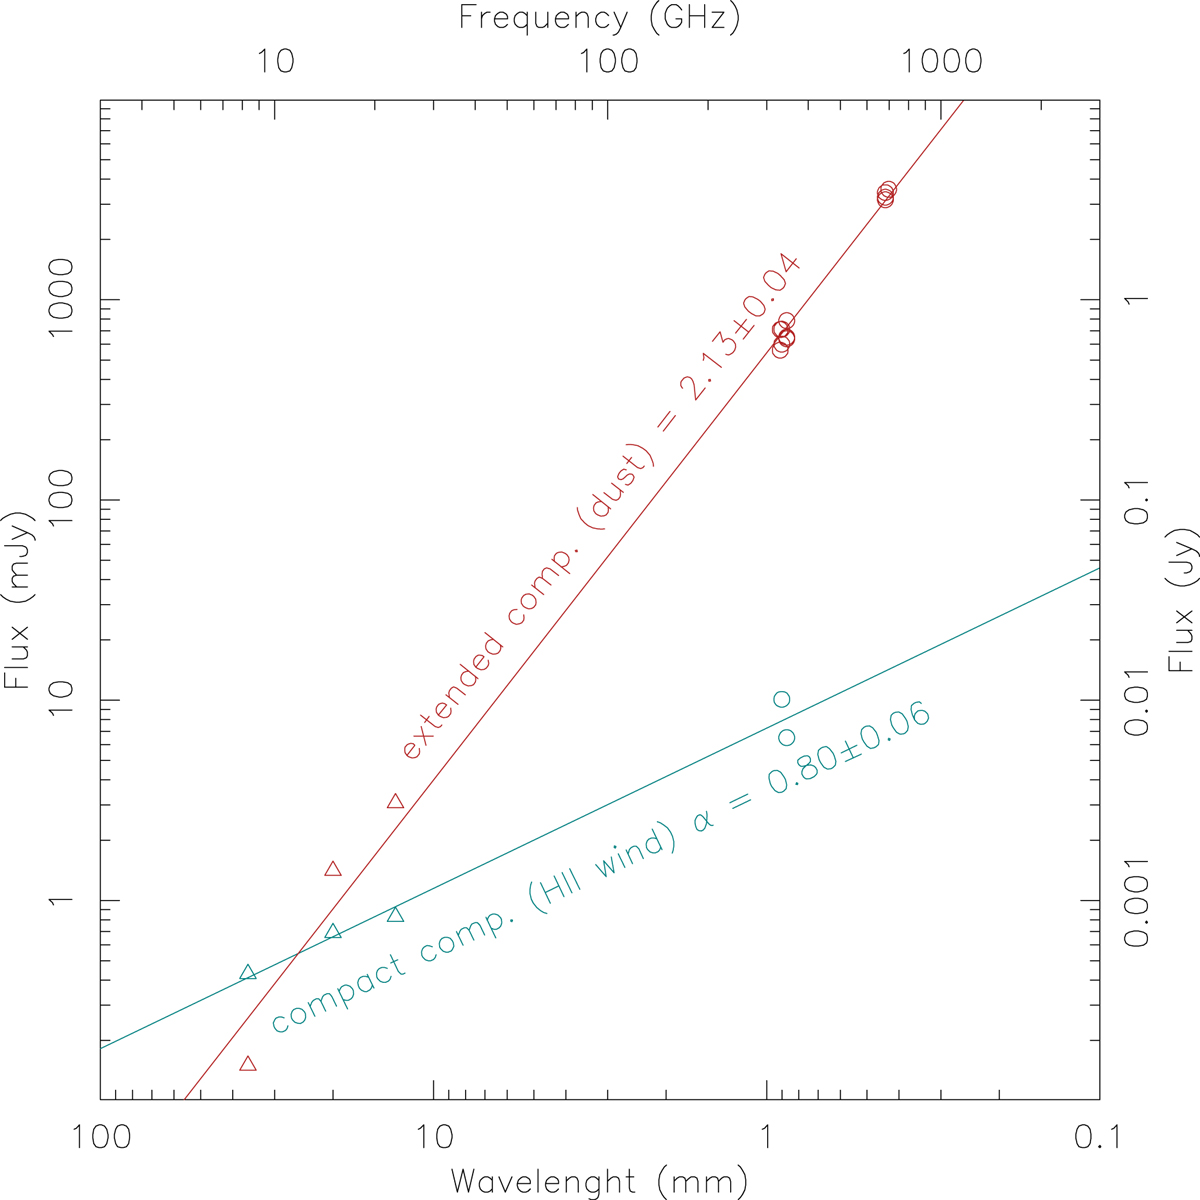
Fig. 2.
Download original image
Measurements of the continuum fluxes in the Red Rectangle, coming from the relatively extended dust emission (red) and the much more compact free–free emission (cyan). The cm-wave data (triangles) come from Jura et al. (1997), submm measurements (circles) are from Bujarrabal et al. (2013a,b, 2016), and this Letter. We also indicate the spectral indexes calculated from regression lines and the formal uncertainties.
Current usage metrics show cumulative count of Article Views (full-text article views including HTML views, PDF and ePub downloads, according to the available data) and Abstracts Views on Vision4Press platform.
Data correspond to usage on the plateform after 2015. The current usage metrics is available 48-96 hours after online publication and is updated daily on week days.
Initial download of the metrics may take a while.