Fig. 1.
Download original image
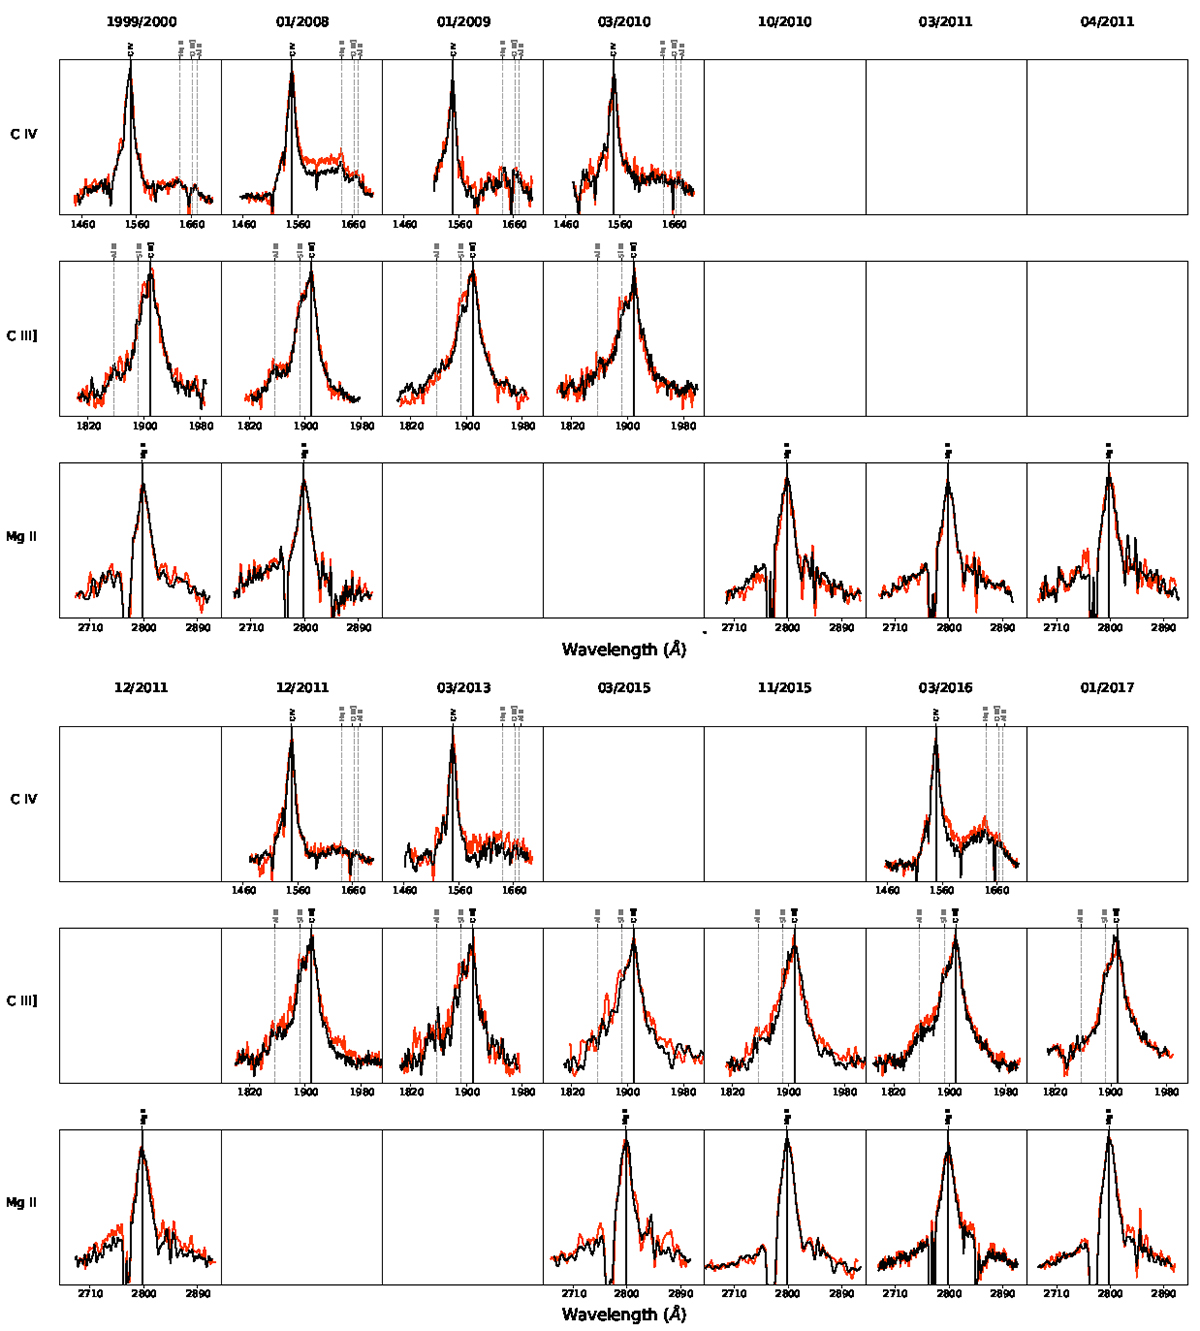
Rest-frame emission line profiles of images A (black) and B (red) for C IV (top), C III] (middle), and Mg II (bottom) displayed in different epochs, with the continuum subtracted and the line cores matched. The leftmost panels depict the spectra of image A taken in April 1999 and image B taken 14 months later (corresponding to the time delay in this system) in June 2000.
Current usage metrics show cumulative count of Article Views (full-text article views including HTML views, PDF and ePub downloads, according to the available data) and Abstracts Views on Vision4Press platform.
Data correspond to usage on the plateform after 2015. The current usage metrics is available 48-96 hours after online publication and is updated daily on week days.
Initial download of the metrics may take a while.