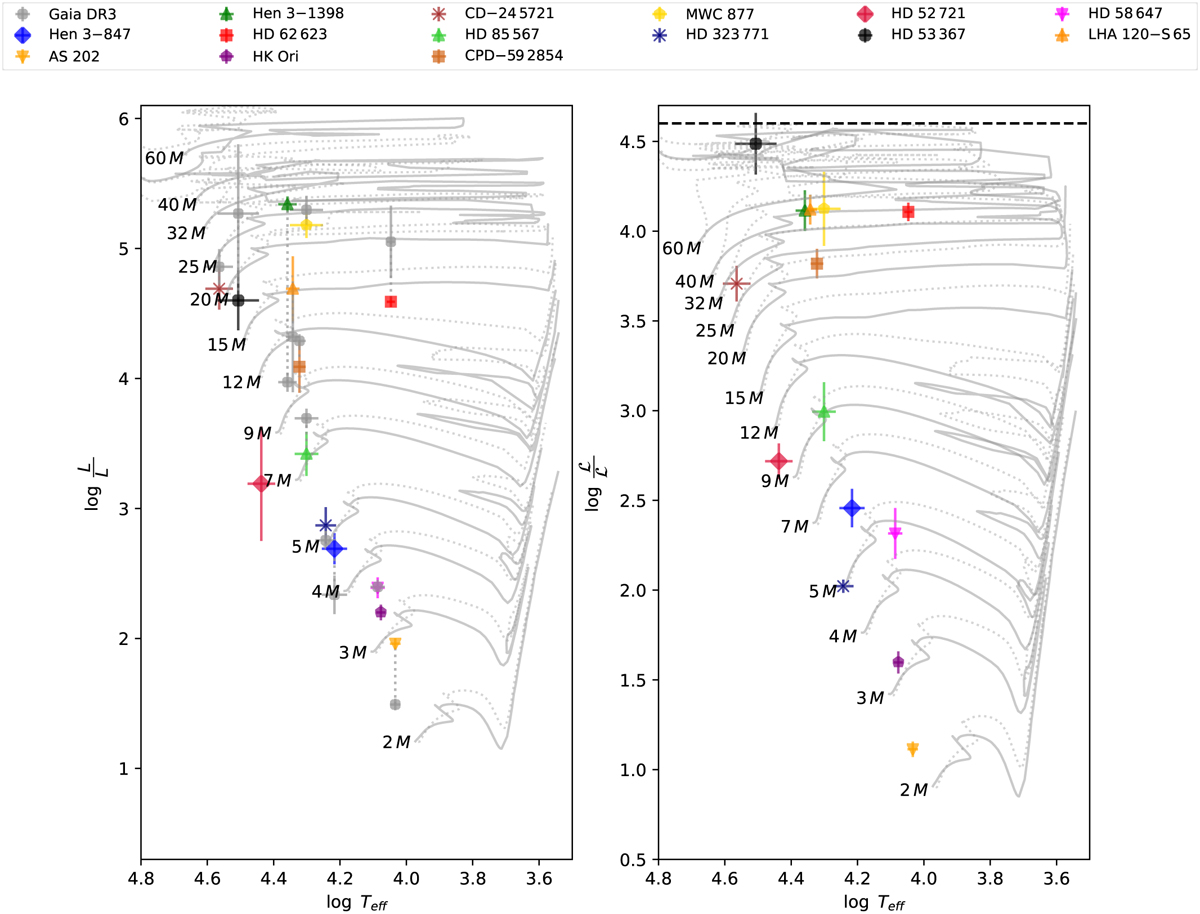
Fig. 3
Download original image
Left: Hertzsprung—Russell diagram for the stars of our sample (coloured symbols). The grey circles indicate the positions of stars as if they were located at distances given by Gaia EDR3 (Bailer-Jones et al. 2021). The BCD and Gaia positions of the same object are connected with dotted lines. Evolutionary tracks with and without rotation (Ω/Ωç = 0.4 and Ω/Ωc = 0.0 in dotted and solid lines, respectively) were taken from Ekström et al. (2012). The positions of Hen 3–847 and AS 202 correspond to mean measurement values obtained at CASLEO and LNA. Right: spectroscopic Hertzsprung–Russell diagram. The dashed black line at log ℒ/ℒ⊙ = 4.6 corresponds to the Eddington luminosity limit for a hydrogen-rich composition (Langer & Kudritzki 2014).
Current usage metrics show cumulative count of Article Views (full-text article views including HTML views, PDF and ePub downloads, according to the available data) and Abstracts Views on Vision4Press platform.
Data correspond to usage on the plateform after 2015. The current usage metrics is available 48-96 hours after online publication and is updated daily on week days.
Initial download of the metrics may take a while.