Open Access
Fig. 4
Download original image
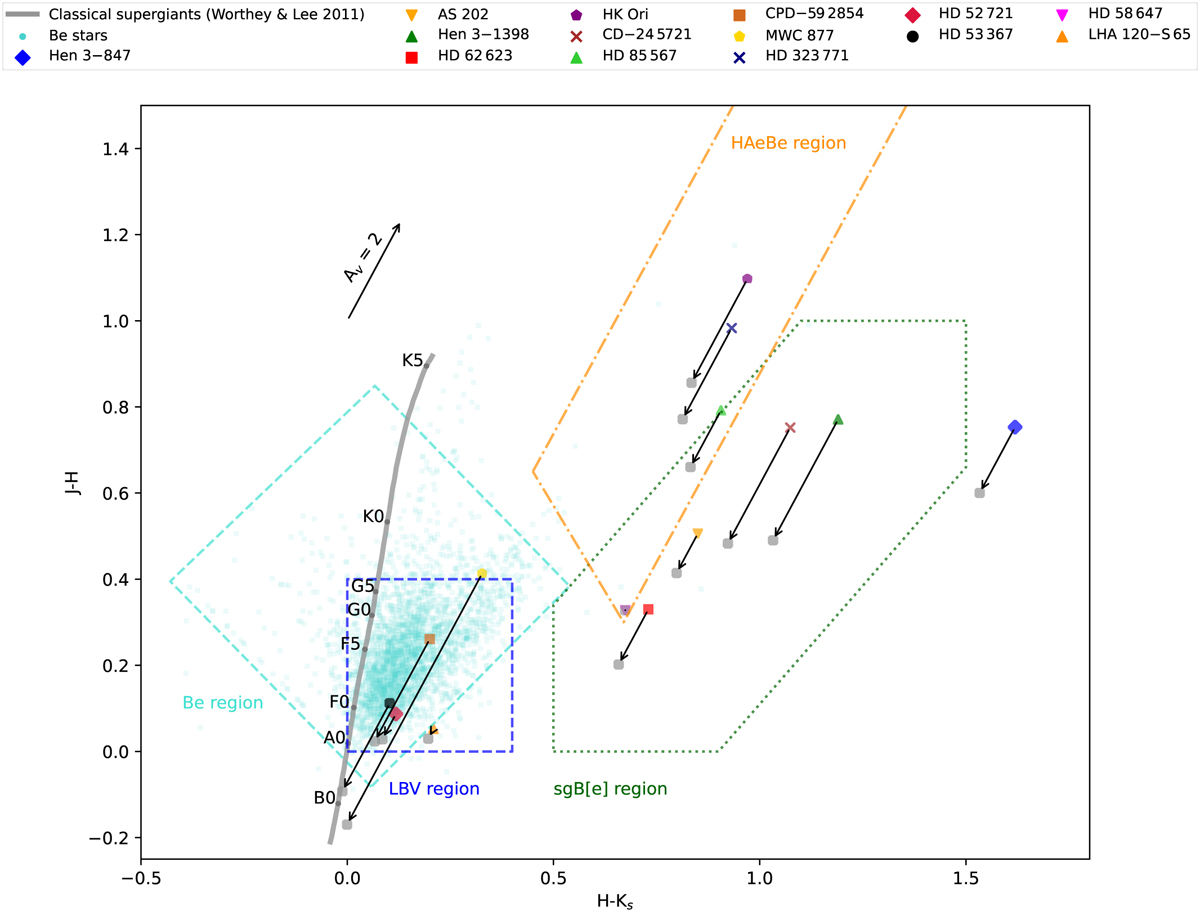
Near-infrared colour–colour diagram. Apparent colours are marked by coloured symbols and true colours are represented by filled grey circles. Data for the same stars are connected with arrows. The thick grey line on the left defines the location of classical supergiants (Worthey & Lee 2011).
Current usage metrics show cumulative count of Article Views (full-text article views including HTML views, PDF and ePub downloads, according to the available data) and Abstracts Views on Vision4Press platform.
Data correspond to usage on the plateform after 2015. The current usage metrics is available 48-96 hours after online publication and is updated daily on week days.
Initial download of the metrics may take a while.