Fig. 10
Download original image
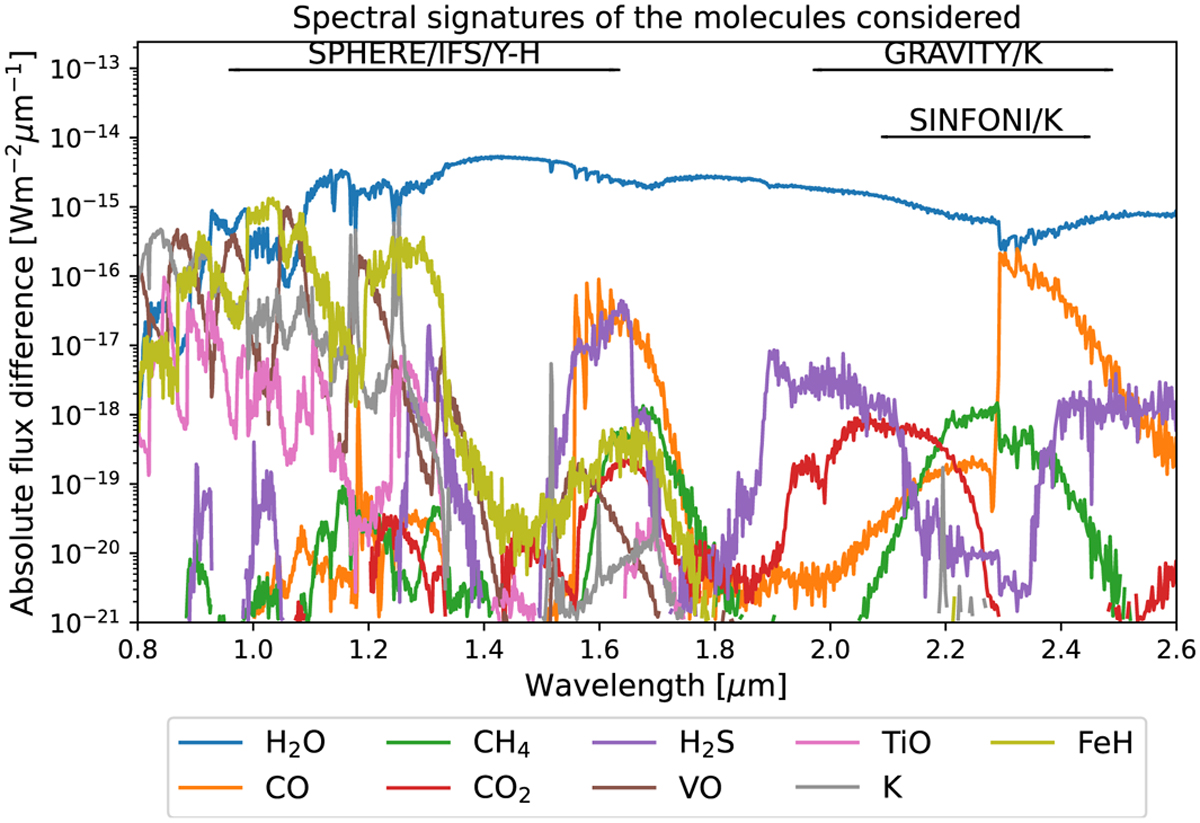
Absolute difference between the spectrum calculated with the full chemical model used for our simulated atmosphere 1 (as described in Table 2) and spectra where each molecule included in our framework was removed one after the other. For example water shows a large difference due to its absorption features throughout the whole range. The black lines indicate the spectral coverage of the different spectroscopic instruments included in our tests.
Current usage metrics show cumulative count of Article Views (full-text article views including HTML views, PDF and ePub downloads, according to the available data) and Abstracts Views on Vision4Press platform.
Data correspond to usage on the plateform after 2015. The current usage metrics is available 48-96 hours after online publication and is updated daily on week days.
Initial download of the metrics may take a while.