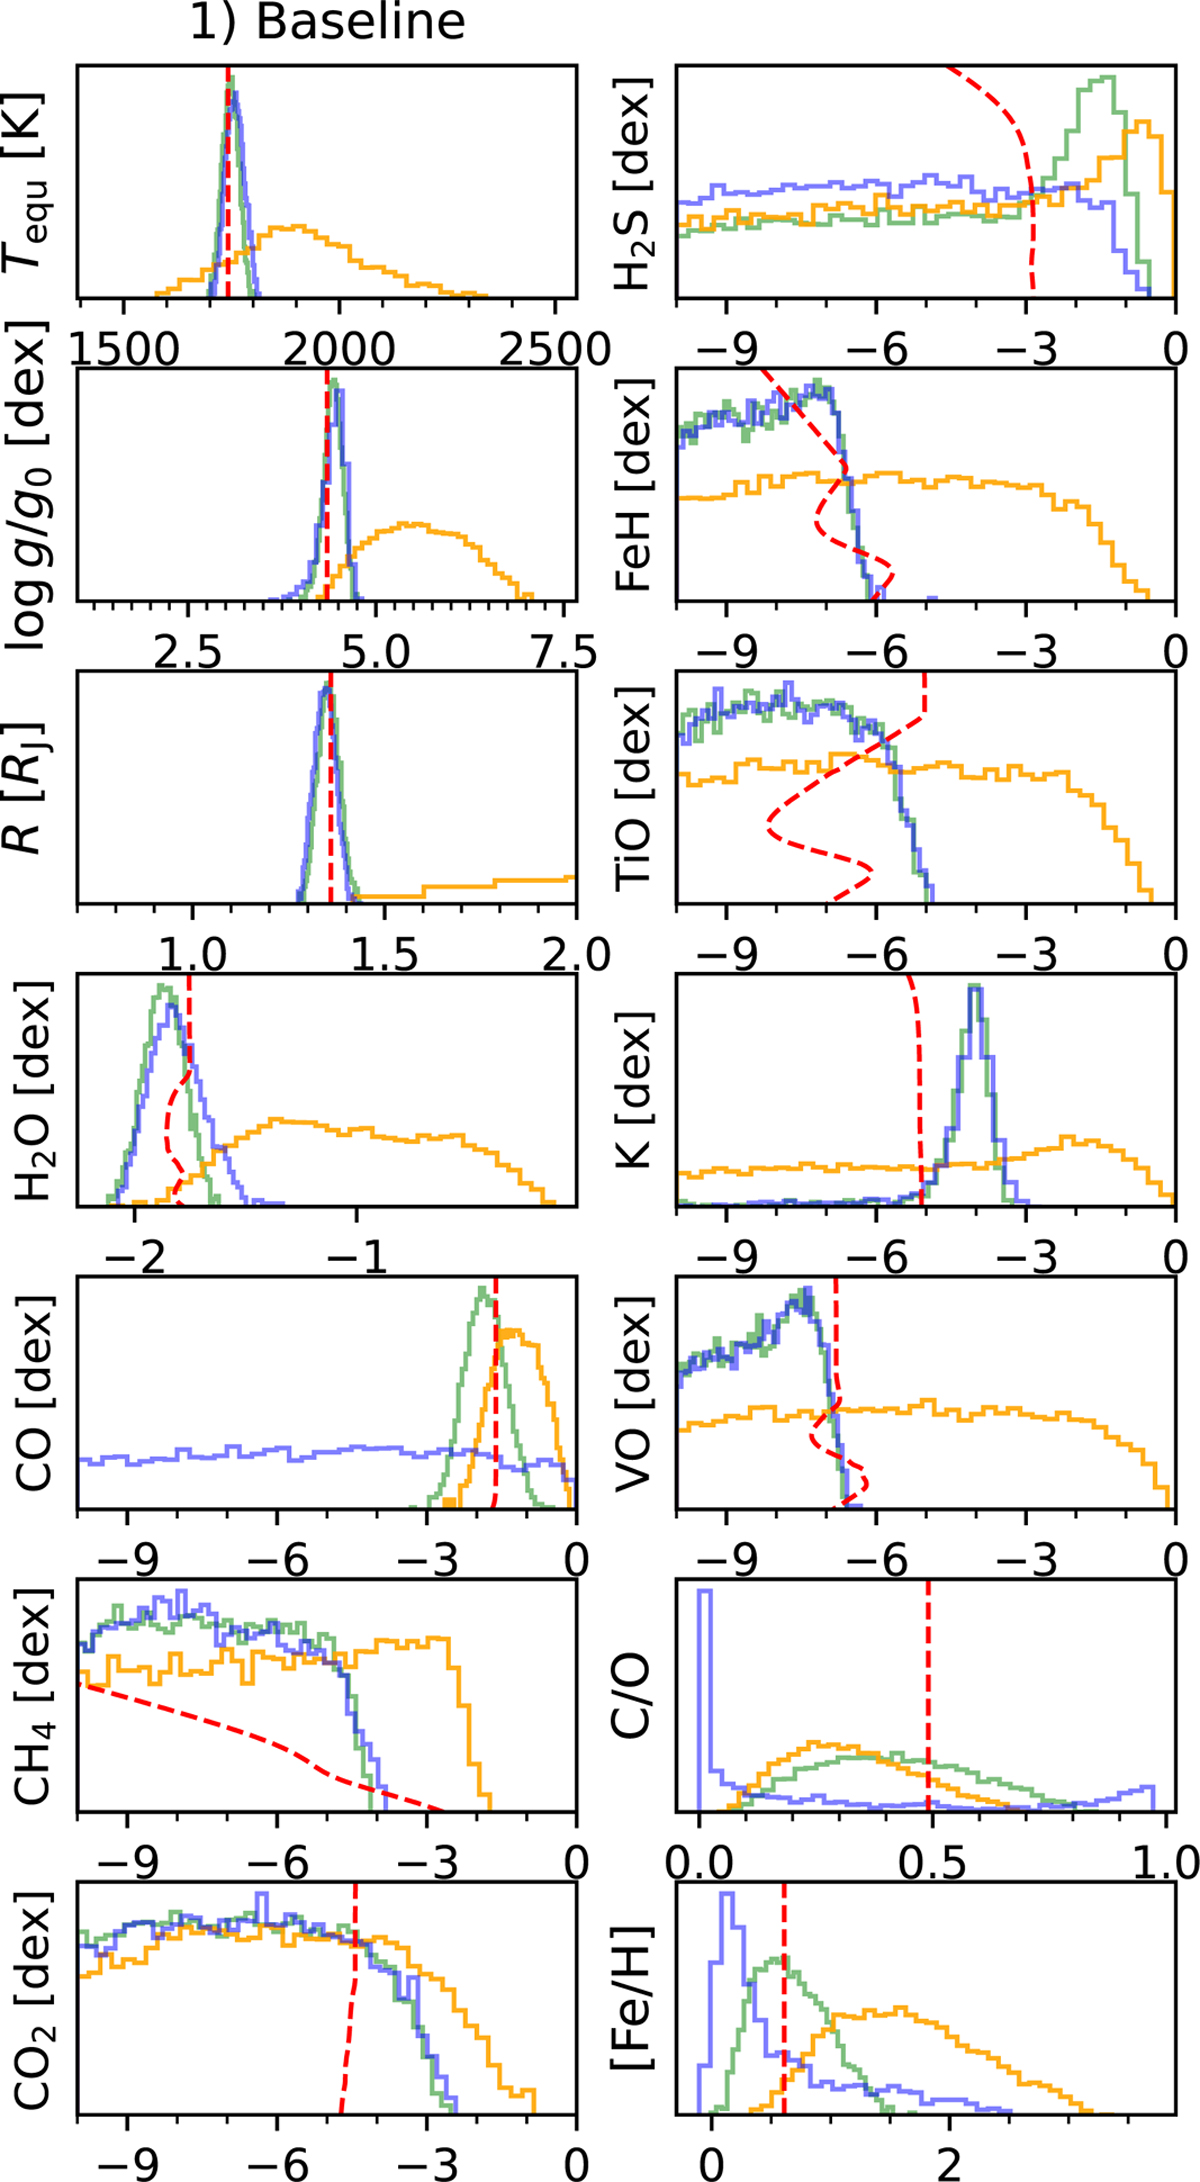
Fig. 11
Download original image
Posterior distributions obtained when removing the synthetic VLTI/GRAVITY data from the atmospheric fit. The input atmosphere is the same as case 1 (cf. Table 2), and as in Fig. 7 we also compare the results when applying CROCODILE to MRCCS data alone (orange), LRSP data (blue), and on both MRCCS+LRSP combined (green). However, this time the low-resolution spectroscopy only included synthetic VLT/SPHERE data in the Y – H bands. The input values are shown as dashed red lines.
Current usage metrics show cumulative count of Article Views (full-text article views including HTML views, PDF and ePub downloads, according to the available data) and Abstracts Views on Vision4Press platform.
Data correspond to usage on the plateform after 2015. The current usage metrics is available 48-96 hours after online publication and is updated daily on week days.
Initial download of the metrics may take a while.