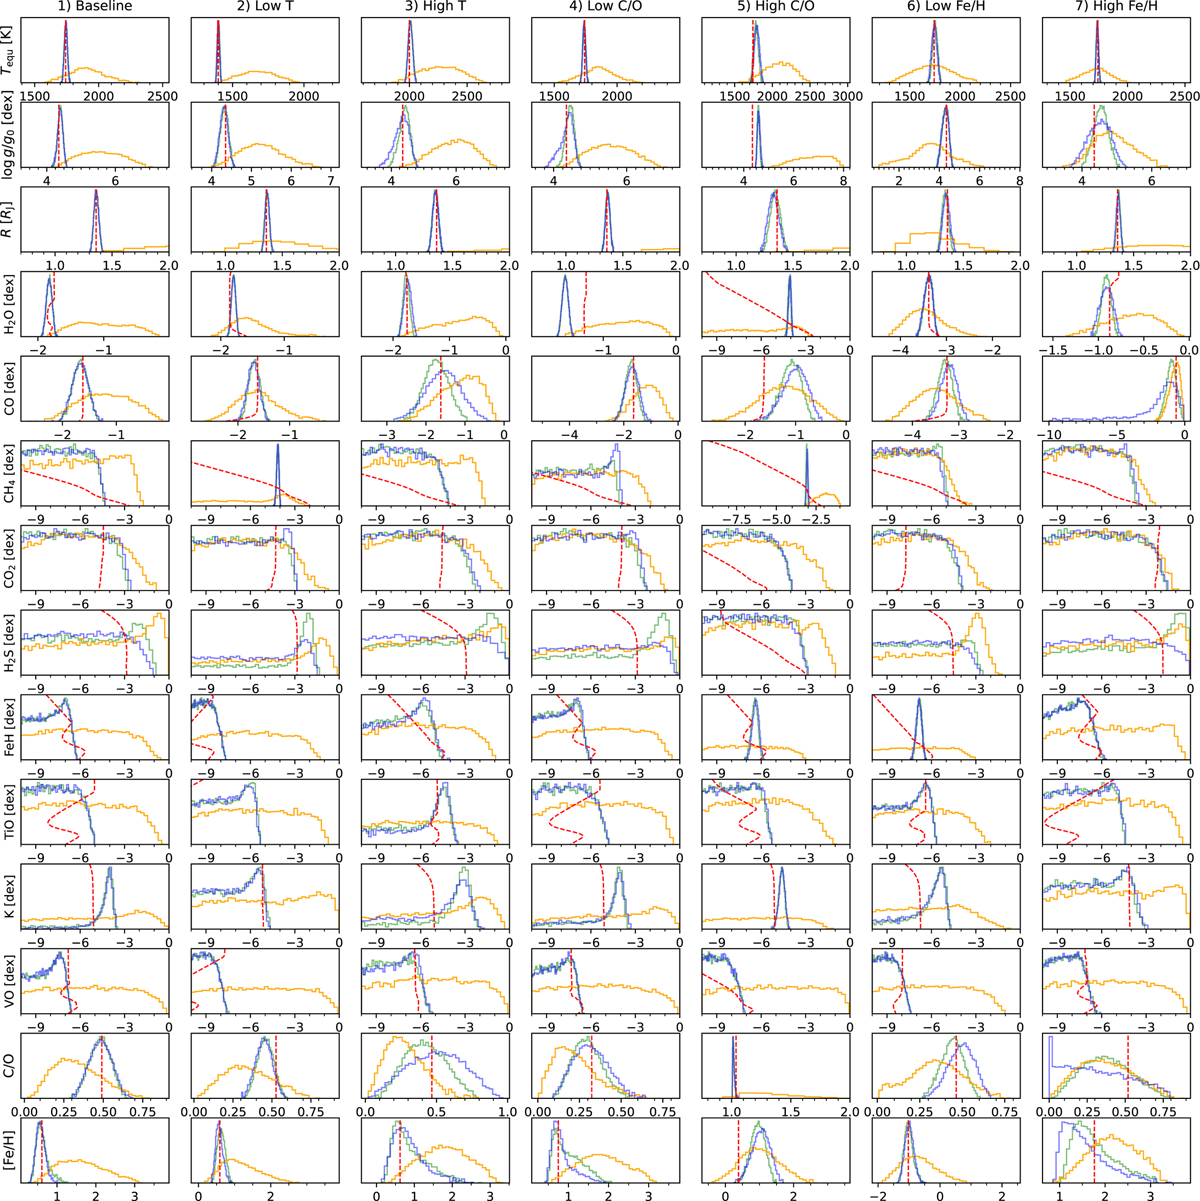
Fig. E.1
Download original image
Comparison of the posterior distributions obtained for the retrievals of our simulated atmospheres 1 to 7 (cf. Table 2) using CROCODILE on MRCCS data alone (orange), on LRSP data (blue), and on both MRCCS+LRSP combined (green). The posterior distributions are shown as histograms of the sampled parameters and are to be read row by row for each model parameter and column by column to compare to the other input atmospheres. The input values are shown as dashed red lines. The input molecular abundances – which were calculated at chemical equilibrium and therefore vary vertically with the pressure and the temperature – are shown as functions of the atmospheric layers between 102 and 10−6 bar in logarithmic scale. The posterior distributions of the C/O ratio and metallicity Fe/H are inferred from the posterior distributions of the molecular abundances.
Current usage metrics show cumulative count of Article Views (full-text article views including HTML views, PDF and ePub downloads, according to the available data) and Abstracts Views on Vision4Press platform.
Data correspond to usage on the plateform after 2015. The current usage metrics is available 48-96 hours after online publication and is updated daily on week days.
Initial download of the metrics may take a while.