Fig. 5
Download original image
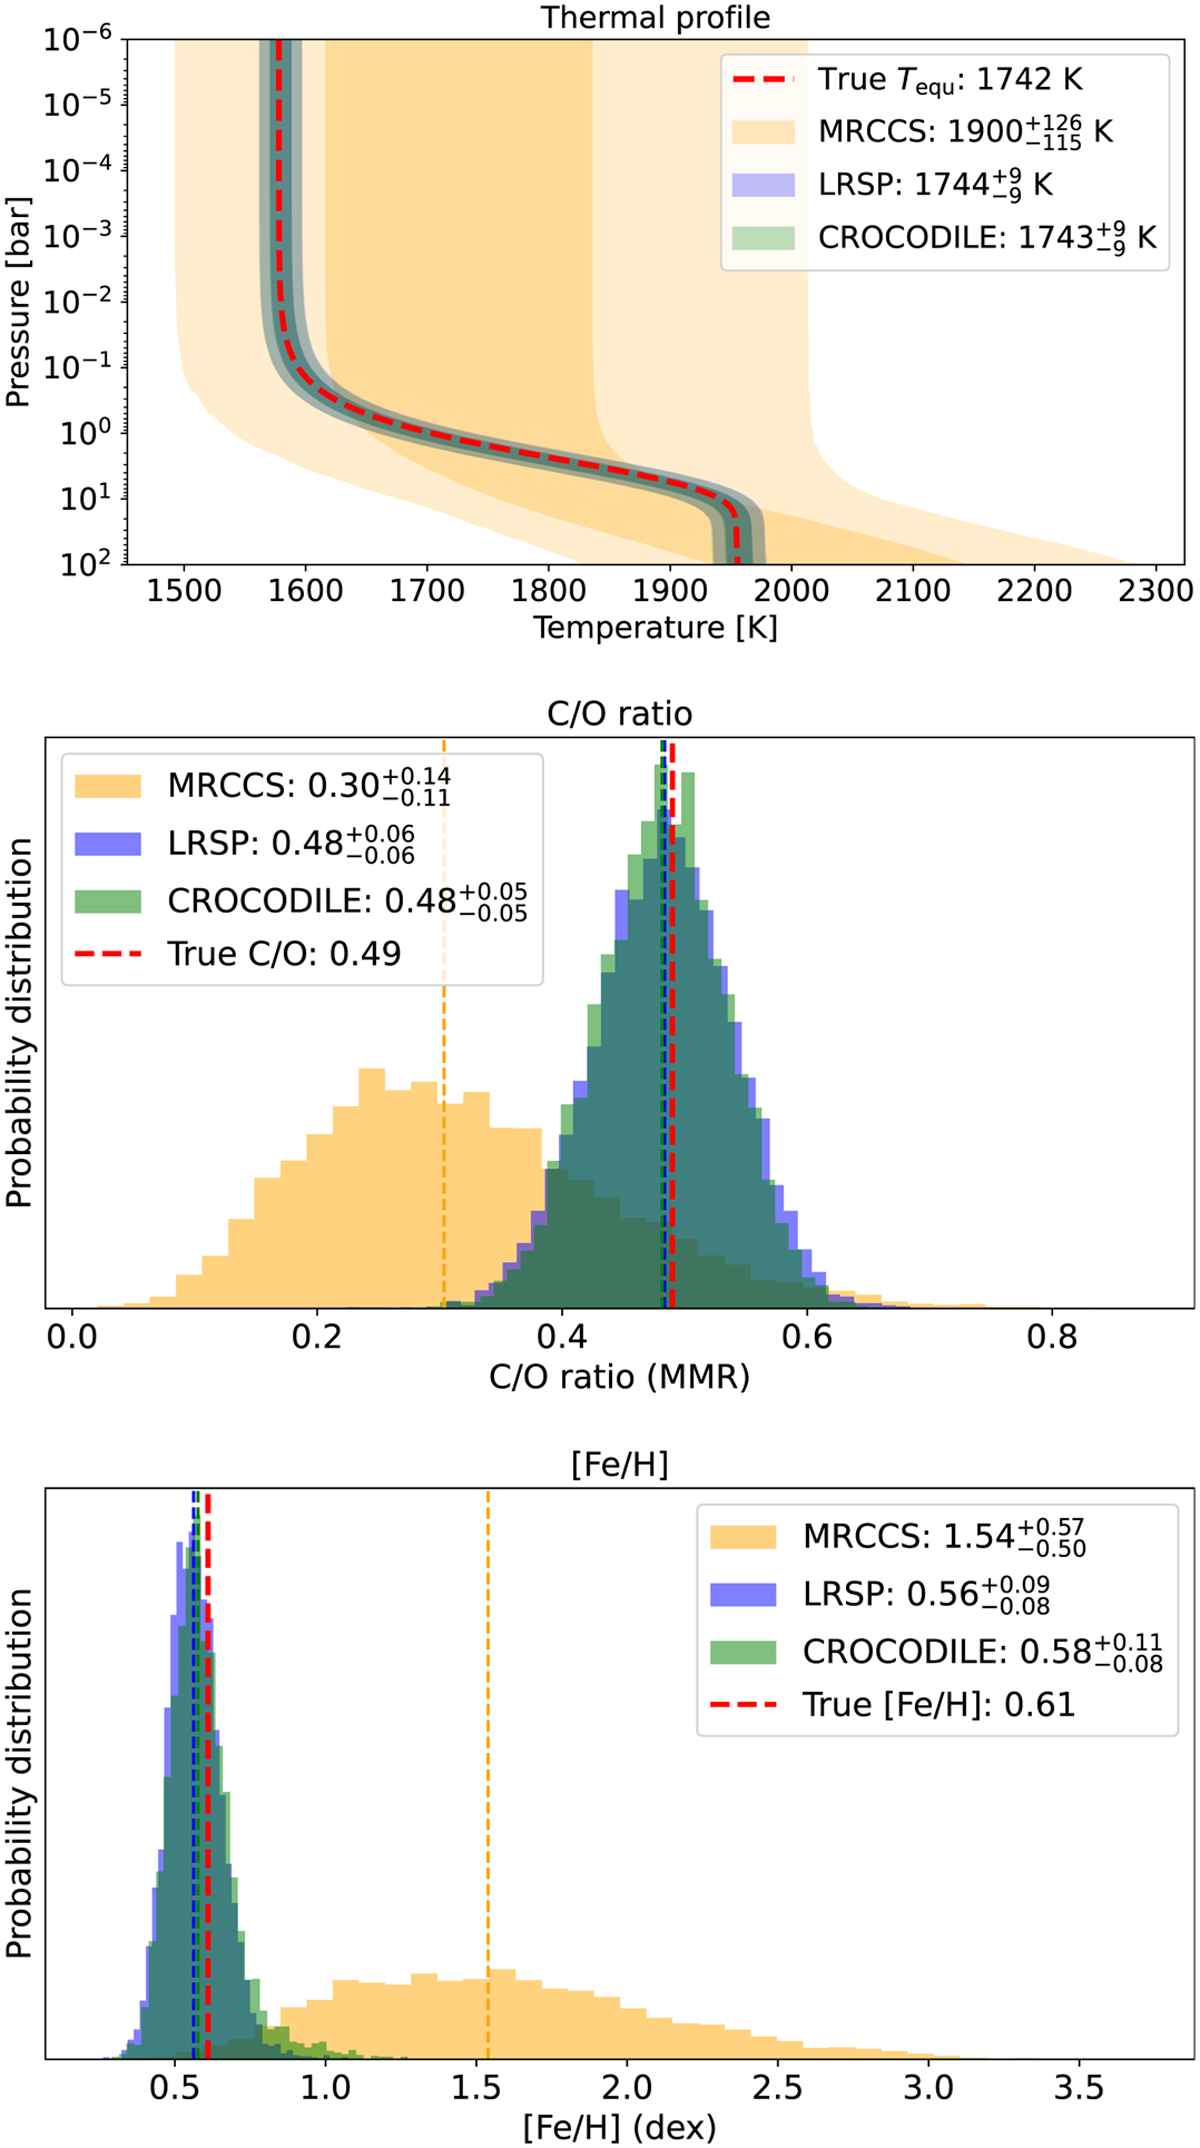
Results of the experiment described in 3.4. Top panel: thermal profiles retrieved for each technique (MRCCS: orange, LRSP: blue, CROCODILE: green). The two levels of opacity correspond to the 16 to 84 and the 2 to 98 percentile envelopes of the thermal profile. The legend reports the median and 64 % confidence interval retrieved for the equilibrium temperature. Middle and bottom panel: posterior distributions of the C/O ratio and metallicity Fe/H inferred from the retrieved abundances for each technique. The dashed lines represent the posterior median. The dashed red line shows the ground truth in every panel.
Current usage metrics show cumulative count of Article Views (full-text article views including HTML views, PDF and ePub downloads, according to the available data) and Abstracts Views on Vision4Press platform.
Data correspond to usage on the plateform after 2015. The current usage metrics is available 48-96 hours after online publication and is updated daily on week days.
Initial download of the metrics may take a while.