Fig. 8
Download original image
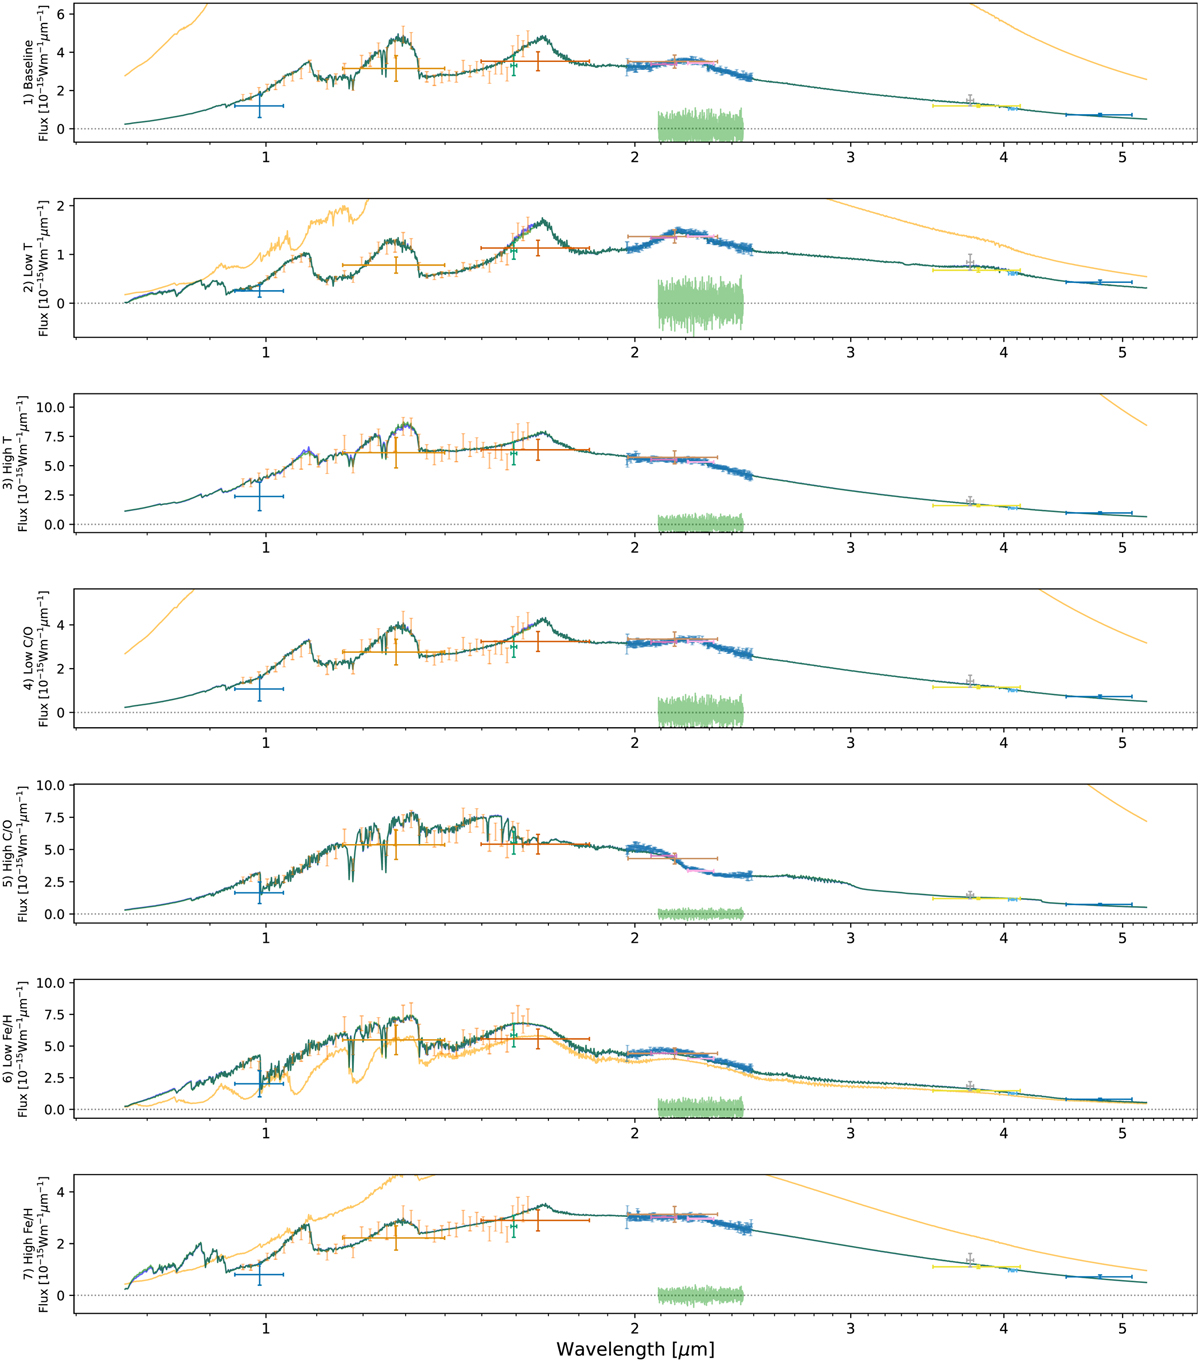
Comparison of the fitted spectra to our simulated datasets 1 to 7 (cf. Table 2) using CROCODILE on MRCCS data alone (orange), on LRSP data (blue), and on both MRCCS+LRSP combined (green). The fitted spectra were calculated using our forward model from the posterior median of the retrieved distributions shown in Fig. E.1. The 11 colourful crosses represent the simulated photometric values and their corresponding uncertainty and equivalent width; the orange and blue error bars show the simulated YH-band VLT/SPHERE/IFS and K-band VLTI/GRAVITY spectra and corresponding uncertainties; and the contiuum-subtracted light green spectrum shows the simulated VLT/SINFONI MRCCS data.
Current usage metrics show cumulative count of Article Views (full-text article views including HTML views, PDF and ePub downloads, according to the available data) and Abstracts Views on Vision4Press platform.
Data correspond to usage on the plateform after 2015. The current usage metrics is available 48-96 hours after online publication and is updated daily on week days.
Initial download of the metrics may take a while.