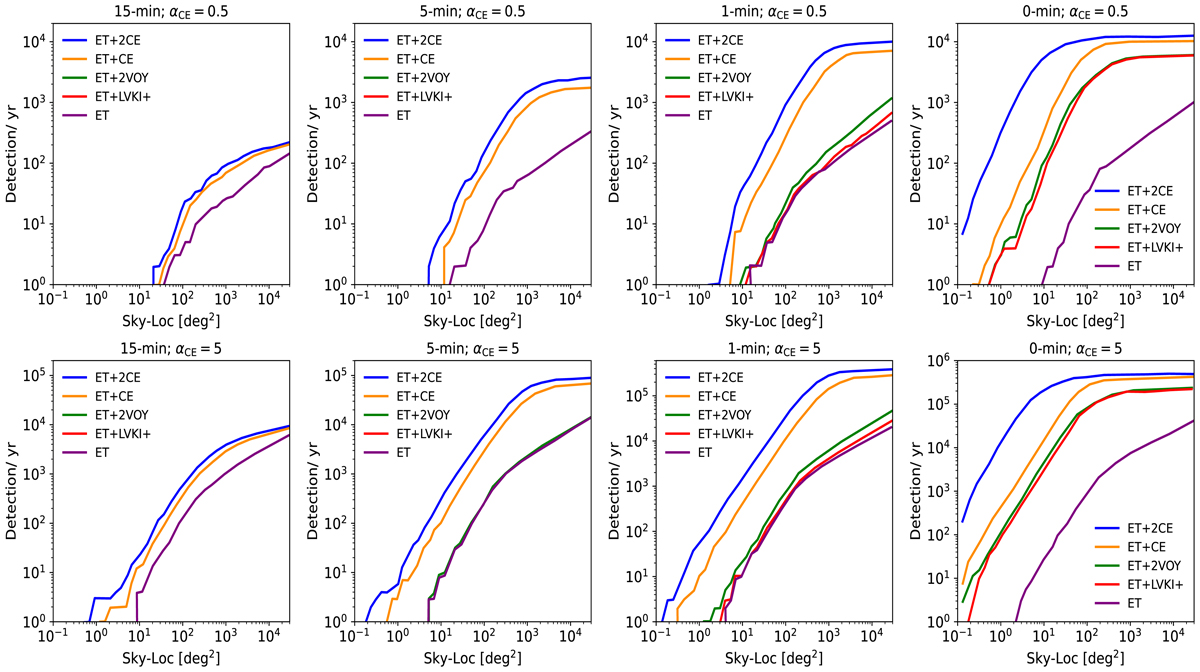
Fig. A.1.
Download original image
Cumulative number of detections (S/N> 8) per year for different networks of GW detectors considering 15, 5, and 1 min before the merger, and at the merger time considering the pessimistic (top row) and optimistic (bottom row) BNS merger population scenarios. The number of injected BNSs is set to 2.0 × 10⁴ and 4.0 × 10⁵ within redshift z = 1.5 for the pessimistic and optimistic scenarios, respectively. The plots show the detections considering BNS systems with all orientations.
Current usage metrics show cumulative count of Article Views (full-text article views including HTML views, PDF and ePub downloads, according to the available data) and Abstracts Views on Vision4Press platform.
Data correspond to usage on the plateform after 2015. The current usage metrics is available 48-96 hours after online publication and is updated daily on week days.
Initial download of the metrics may take a while.