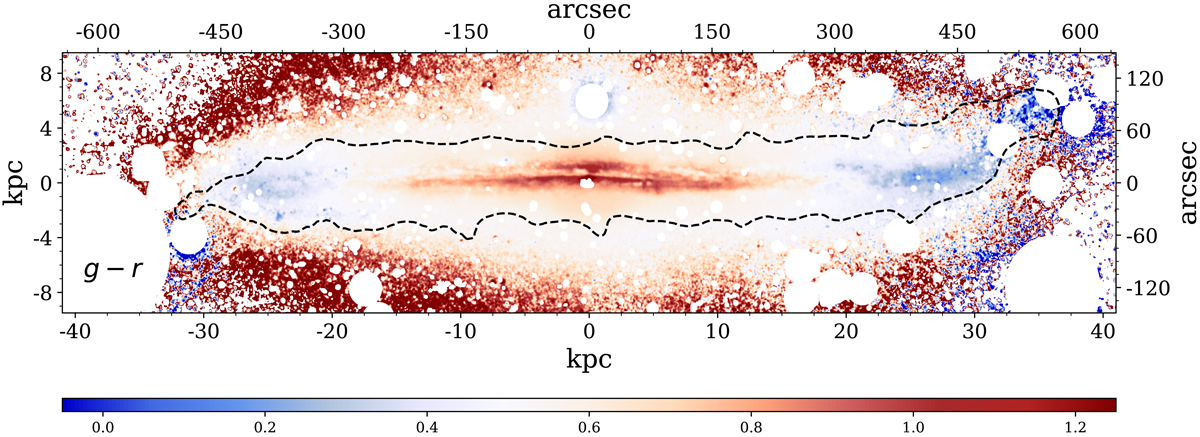
Fig. 10.
Download original image
g–r colour map of NGC 4565 with values indicated in the bottom colour bar. The dashed black line shows the outermost H I isocontour. The warp is traced with bluer colours in the off-plane regions along the upper-right side of the disk. We can also see the bluer regions, which are less affected by dust, around the truncation (R ∼ 26 kpc). Also, the H I emission follows the optical light distribution.
Current usage metrics show cumulative count of Article Views (full-text article views including HTML views, PDF and ePub downloads, according to the available data) and Abstracts Views on Vision4Press platform.
Data correspond to usage on the plateform after 2015. The current usage metrics is available 48-96 hours after online publication and is updated daily on week days.
Initial download of the metrics may take a while.