Open Access
Fig. A.4.
Download original image
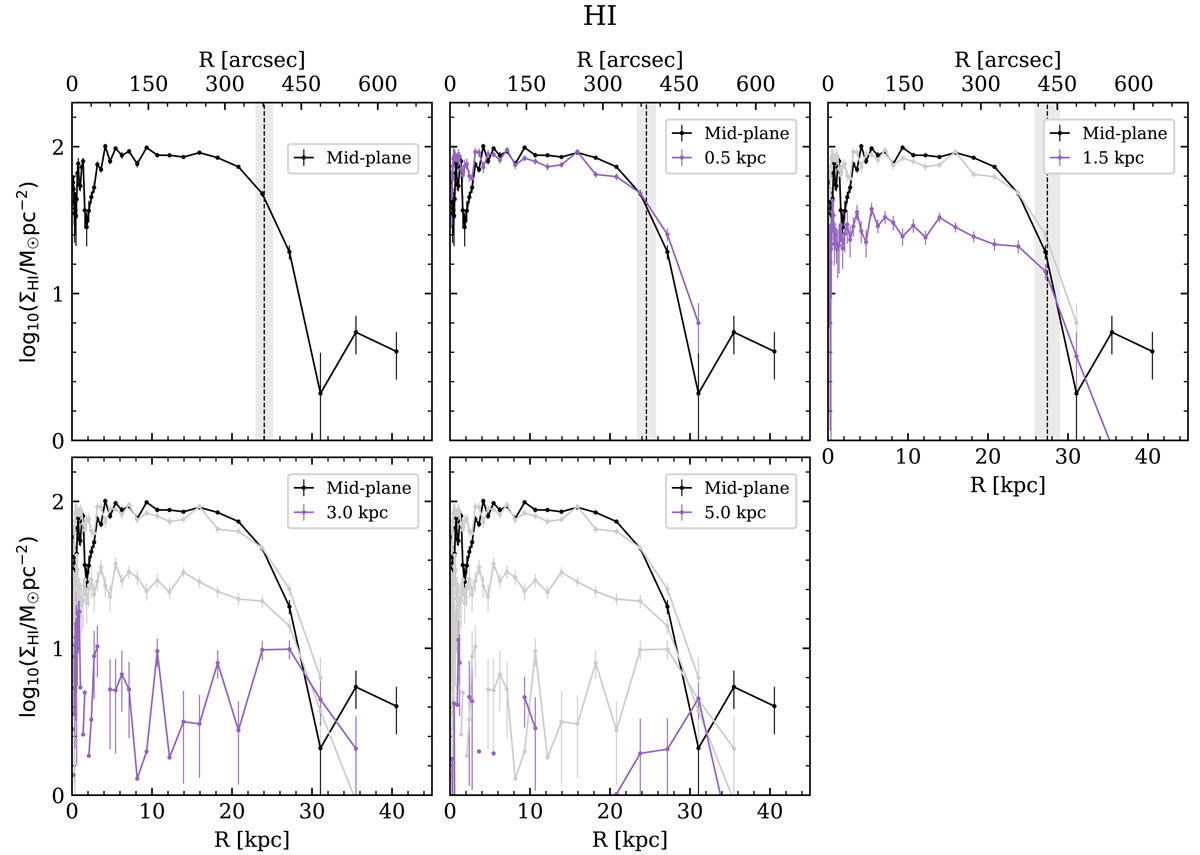
Same as Fig. A.1 but showing the vertical development of the radial surface mass density profiles in M⊙ pc−2 extracted from the H I integrated maps. The vertical line indicates the truncation radial position for each height above and below the galaxy mid-plane, and the light grey shaded region is the associated uncertainty.
Current usage metrics show cumulative count of Article Views (full-text article views including HTML views, PDF and ePub downloads, according to the available data) and Abstracts Views on Vision4Press platform.
Data correspond to usage on the plateform after 2015. The current usage metrics is available 48-96 hours after online publication and is updated daily on week days.
Initial download of the metrics may take a while.