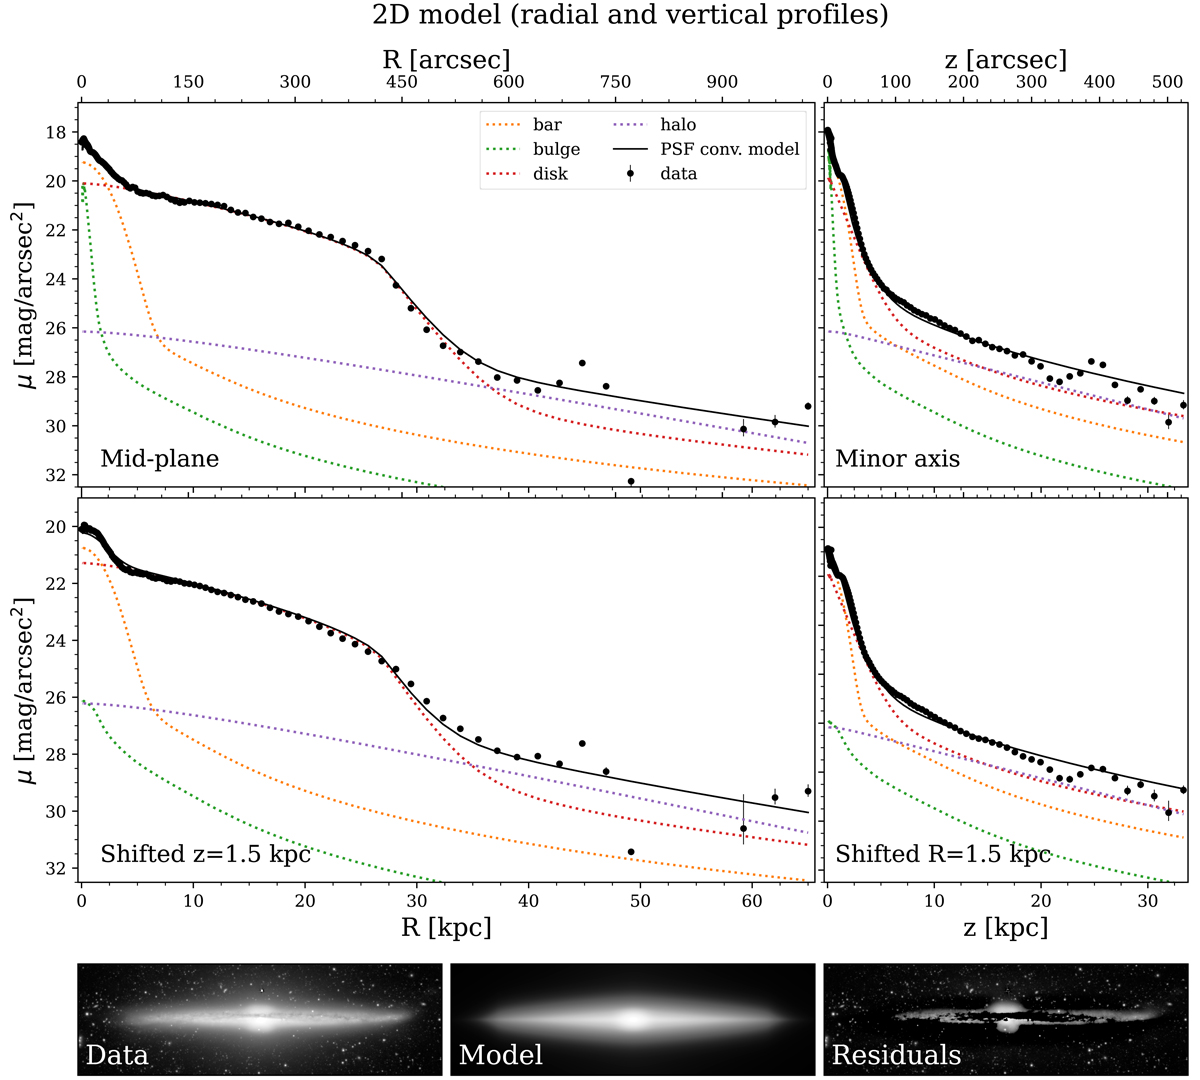
Fig. B.1.
Download original image
Comparison between the observed data and the 2D galaxy model. Top four panels: Radial (left) and vertical (right) surface brightness profiles of the observed data and the 2D galaxy model in the r band, convolved with the extended PSF (solid black line). We show the model galaxy components colour-coded as in the legend, along with the observed data (black points). The top two panels show the central profiles in each case, while the other two panels are the profiles shifted by 1.5 kpc from the ones above. Bottom three panels: Images of the observed NGC 4565 data in the r band (left), its model (centre) obtained with IMFIT as explained in Sect. 3.3, and the associated residuals (right). The model reproduces NGC 4565 and the residuals are minimal, accounting only for the dusty regions surrounding the mid-plane and some asymmetries.
Current usage metrics show cumulative count of Article Views (full-text article views including HTML views, PDF and ePub downloads, according to the available data) and Abstracts Views on Vision4Press platform.
Data correspond to usage on the plateform after 2015. The current usage metrics is available 48-96 hours after online publication and is updated daily on week days.
Initial download of the metrics may take a while.