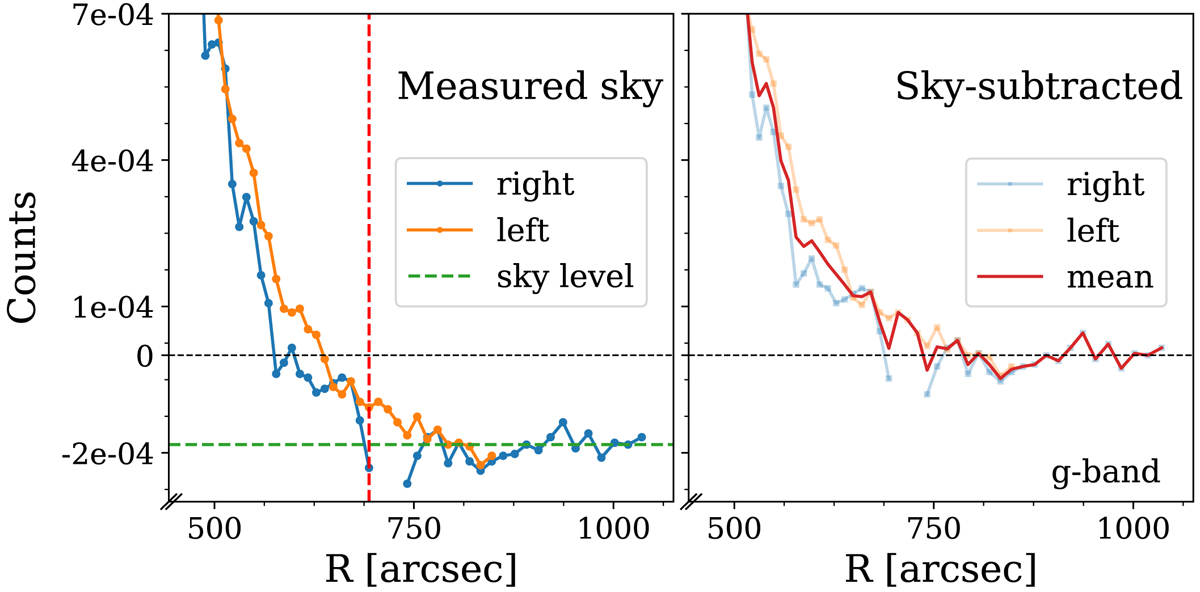
Fig. 2.
Download original image
Local sky correction for the g broadband image. We show the outer parts of the profiles in detail (R > 450 arcsec) along both sides of the galaxy disk. The profile extracted from the right side of the disk of NGC 4565 is in blue, and the one from the left side is in orange. Left panel: measured sky profiles. The vertical dashed red line indicates the radial distance from which we measured the mean sky value, the horizontal dashed green line is located at the measured mean sky level, and the dotted black line shows the zero counts level. Right panel: sky-subtracted profiles, that is, the result of subtracting the mean sky value from the profiles in the left panel. The mean profile of the whole disk is shown with a solid red line. The profiles are slightly corrected for over- and under-subtracted areas around our target.
Current usage metrics show cumulative count of Article Views (full-text article views including HTML views, PDF and ePub downloads, according to the available data) and Abstracts Views on Vision4Press platform.
Data correspond to usage on the plateform after 2015. The current usage metrics is available 48-96 hours after online publication and is updated daily on week days.
Initial download of the metrics may take a while.