Fig. 5.
Download original image
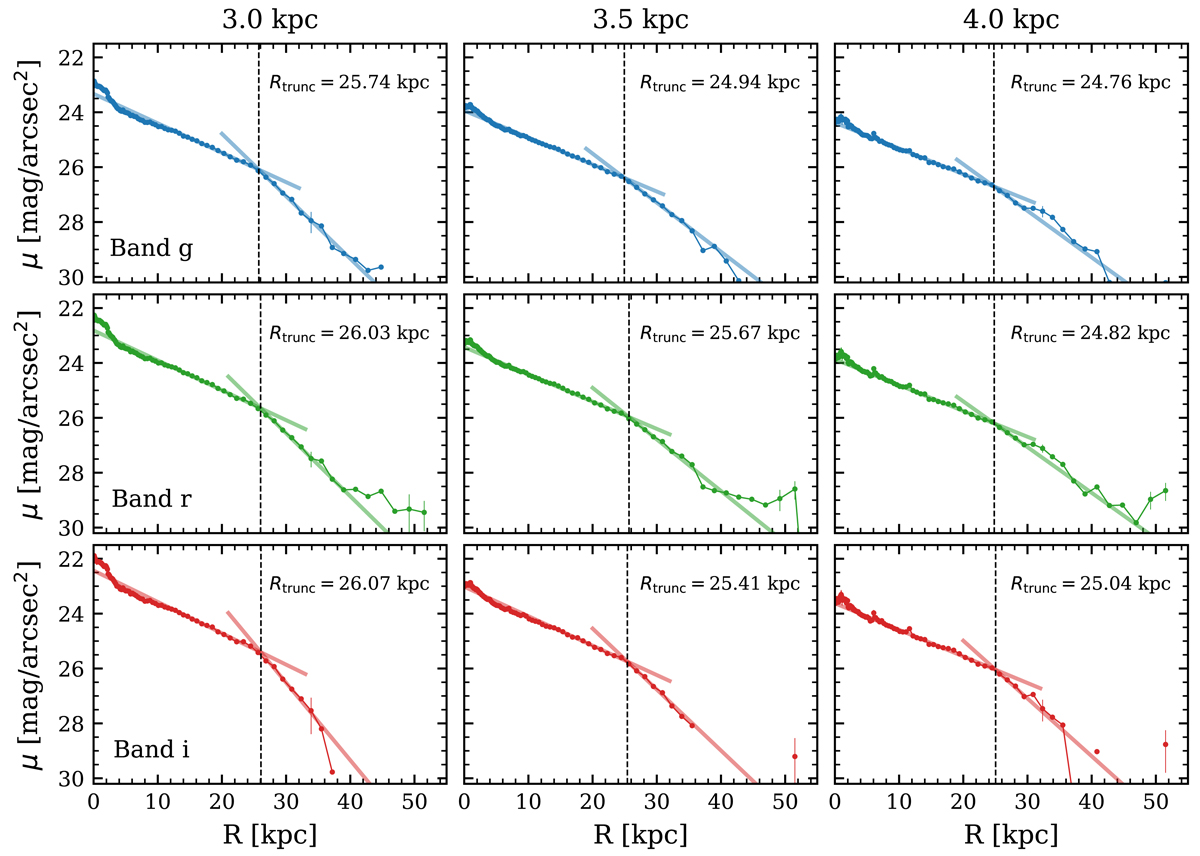
Detail of the two linear fits (transparent straight lines) before and after the truncation radius. These lines fit the RSBPs extracted at 3, 3.5, and 4 kpc above and below the galaxy mid-plane (columns) for each ultra-deep g (blue), r (green), and i (red) band (rows). The surface brightness profiles are those from the PSF-deconvolved models of NGC 4565 shown in Figs. A.5–A.7. In each panel, the intersection radius between the two lines provides the truncation radius of the corresponding profile, which is indicated with a dashed vertical line. The truncation radius value is indicated in the top-right corner.
Current usage metrics show cumulative count of Article Views (full-text article views including HTML views, PDF and ePub downloads, according to the available data) and Abstracts Views on Vision4Press platform.
Data correspond to usage on the plateform after 2015. The current usage metrics is available 48-96 hours after online publication and is updated daily on week days.
Initial download of the metrics may take a while.