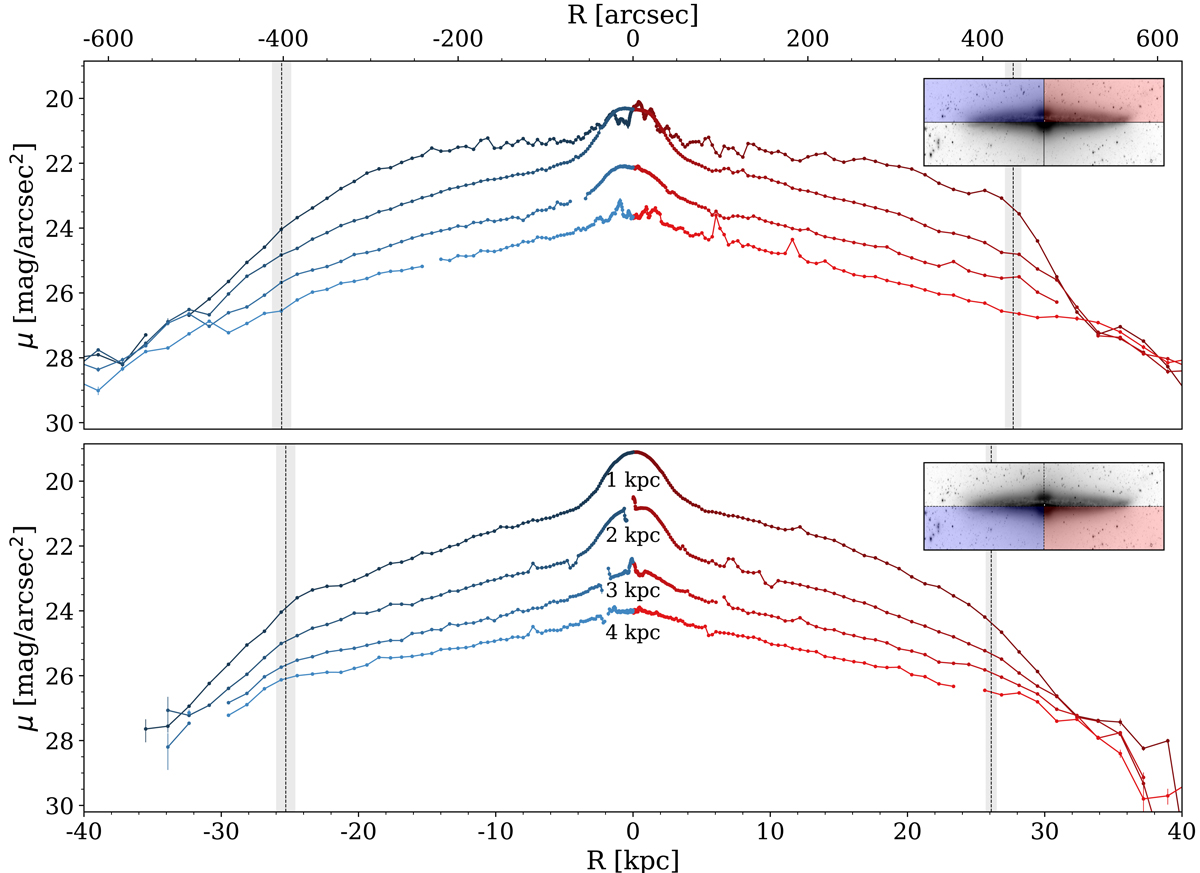
Fig. 6.
Download original image
NGC 4565 RSBPs in the r band for the four disk quadrants and at four different heights above and below the mid-plane as indicated in the bottom panel (i.e. at heights of 1, 2, 3, and 4 kpc). The vertical dashed lines are placed at the mean truncation radius of each quadrant. The standard deviation of the truncation position distribution is represented with shaded grey regions. In each panel, the upper-right insets with the image of NGC 4565 show two colour-shaded regions that indicate the quadrants where the RSBPs were extracted and are colour-coded accordingly. The vertical development of the truncation radius is sharper on the NW side (right; in red) of the disk while the south-east (SE) side (left; in blue) shows two breaks along the radial distribution. The first break is at a radius of ∼17 kpc, and the second corresponds to the truncation. Nonetheless, the truncation radius remains similar within the uncertainties for the three quadrants without a strong warp feature.
Current usage metrics show cumulative count of Article Views (full-text article views including HTML views, PDF and ePub downloads, according to the available data) and Abstracts Views on Vision4Press platform.
Data correspond to usage on the plateform after 2015. The current usage metrics is available 48-96 hours after online publication and is updated daily on week days.
Initial download of the metrics may take a while.