Fig. A.1.
Download original image
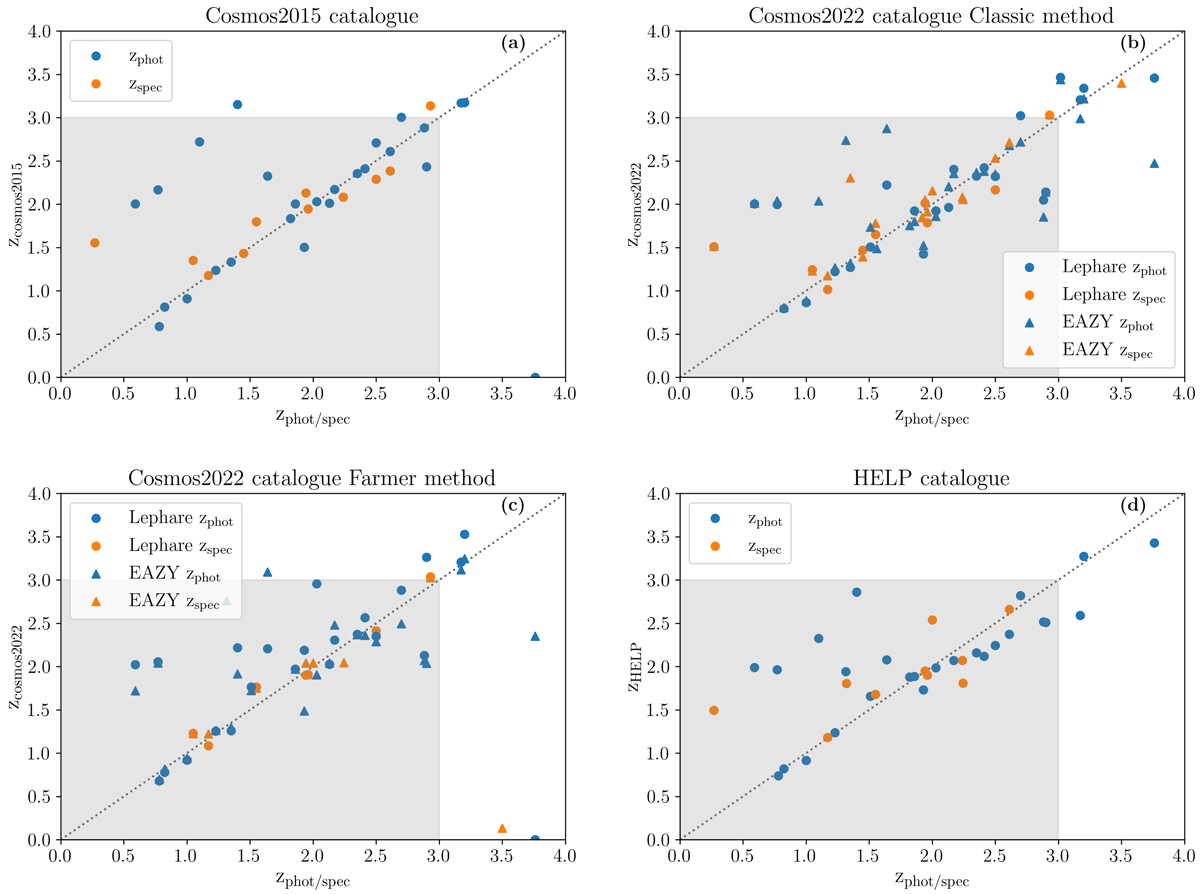
Comparison betthe orange points depict the spectroscopic values from the literature. Notably, the Cosmos2020 catalogue yields two distinct sets of results beween the Cosmos2015 (a), Cosmos2020 (b and c), and HELP (d) catalogues and our redshift values for our sample. The blue points in each plot correspond to the photometric z values from each catalogue, and cause two different SED fitting codes were used: Lephare and EAZY, denoted by circles and triangles, respectively.
Current usage metrics show cumulative count of Article Views (full-text article views including HTML views, PDF and ePub downloads, according to the available data) and Abstracts Views on Vision4Press platform.
Data correspond to usage on the plateform after 2015. The current usage metrics is available 48-96 hours after online publication and is updated daily on week days.
Initial download of the metrics may take a while.