Fig. 3.
Download original image
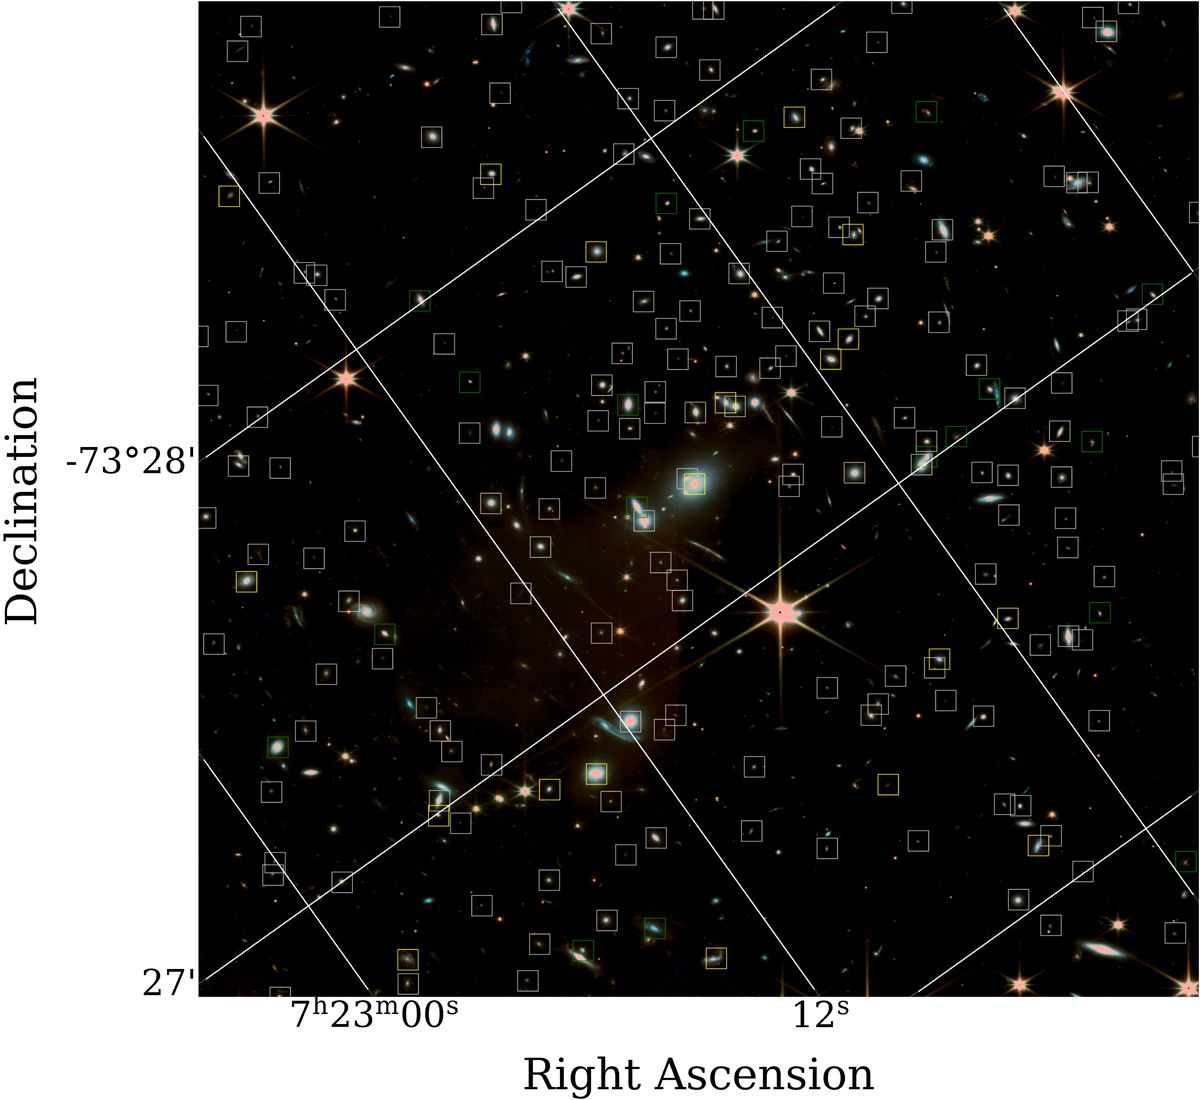
JWST color image of SMACS0723 showing the spatial distribution of cluster members confirmed spectroscopically (green) and using our color-magnitude cuts (white). This image was produced from our reduced data products via a composite of data in 3 bands: F090W, F150W, F200W. F090W was assigned blue colours, F150W green, and F200W red.
Current usage metrics show cumulative count of Article Views (full-text article views including HTML views, PDF and ePub downloads, according to the available data) and Abstracts Views on Vision4Press platform.
Data correspond to usage on the plateform after 2015. The current usage metrics is available 48-96 hours after online publication and is updated daily on week days.
Initial download of the metrics may take a while.