Fig. 1
Download original image
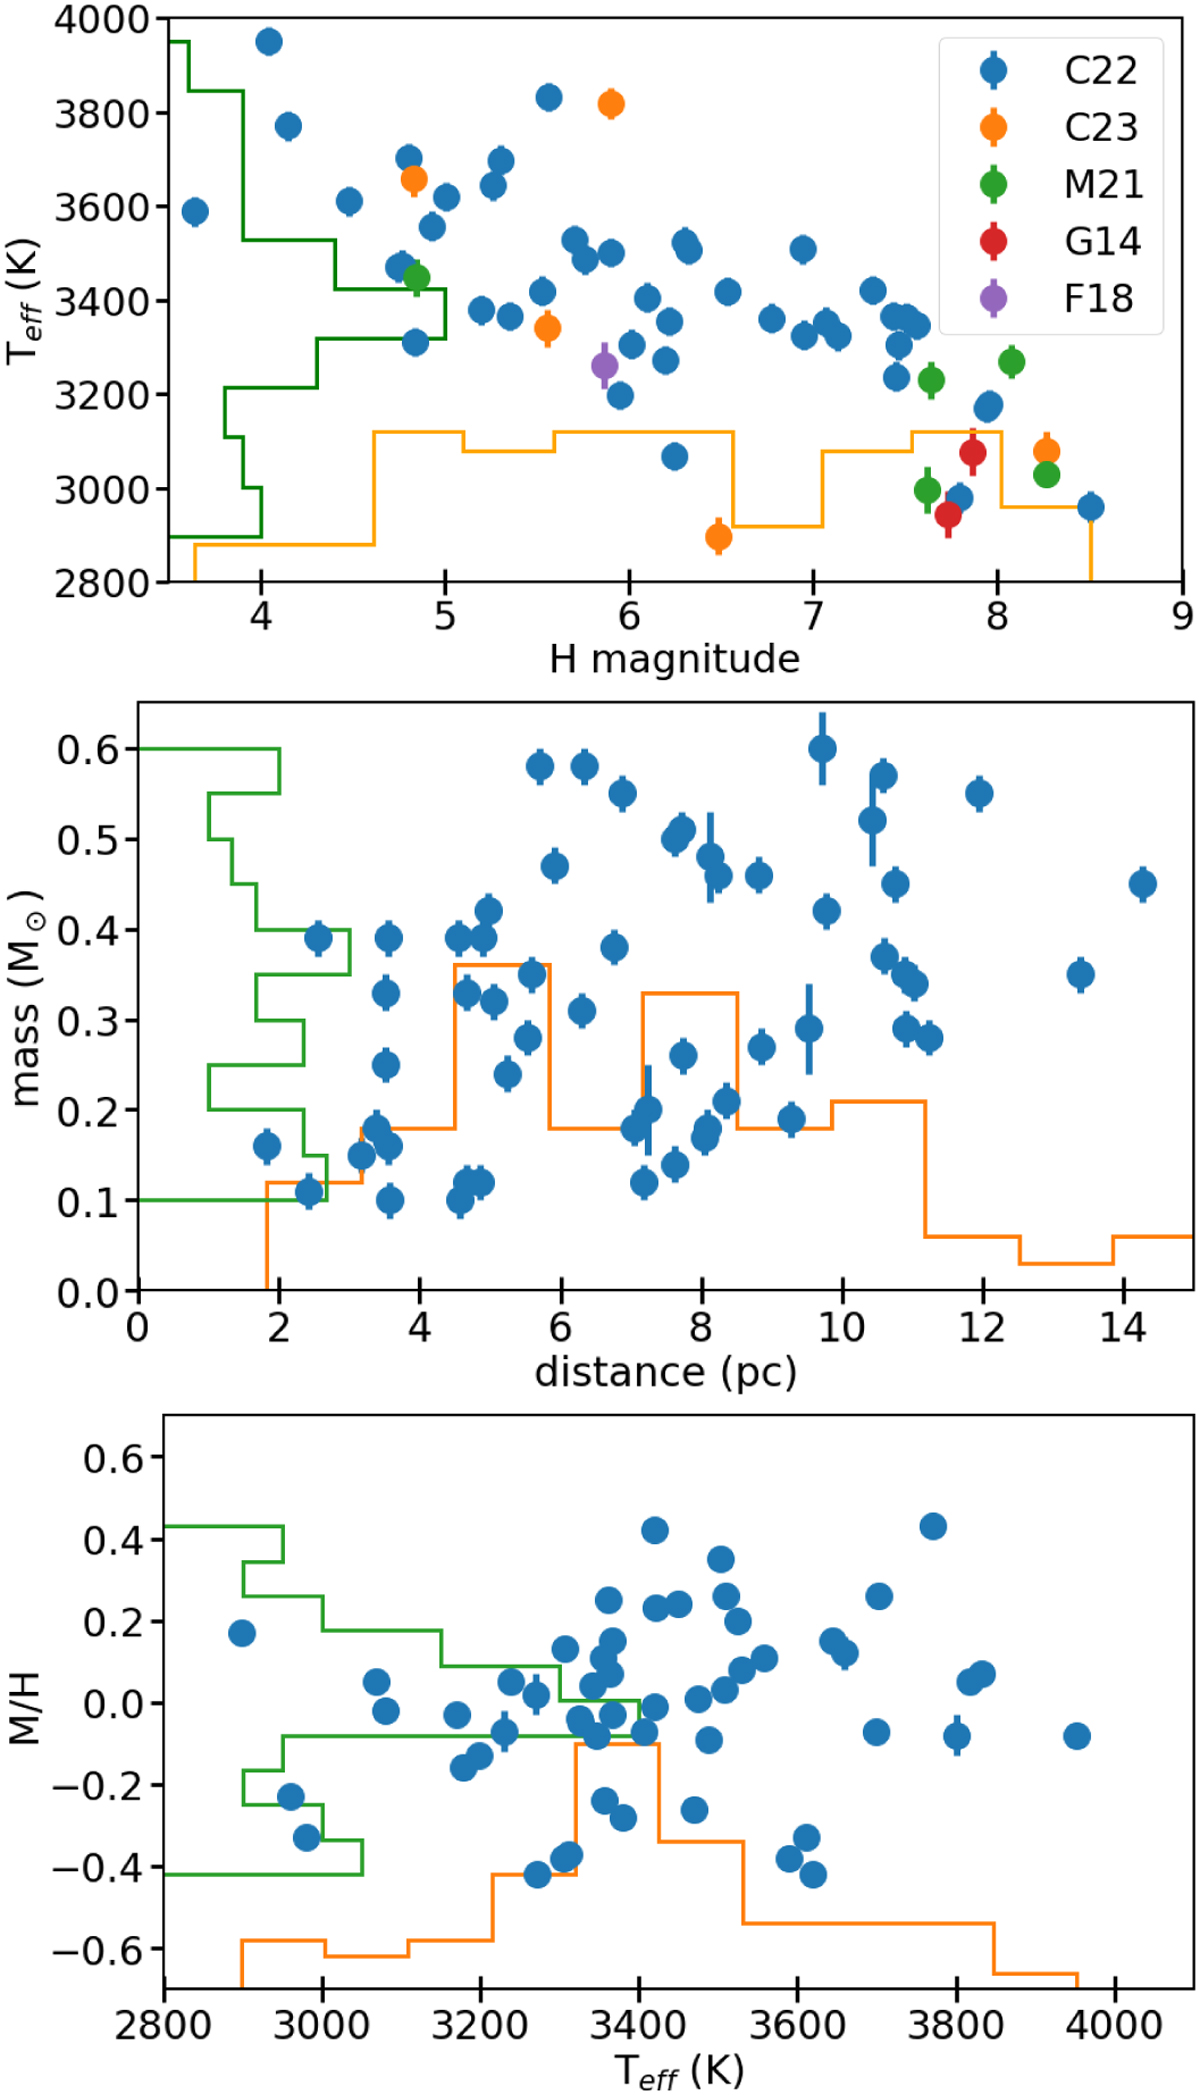
Sample characteristics. Top: distribution of effective temperatures as a function of H-band magnitudes in the stellar sample. The colors indicate the source of the temperature measurement: C22 (Cristofari et al. 2022), C23 (Cristofari et al. 2023), M21 (Marfil et al. 2021), G14 (Gaidos et al. 2014), and F18 (Fouqué et al. 2018). Middle: distribution of stellar masses and distances. Bottom: distribution of metallicities and effective temperatures.
Current usage metrics show cumulative count of Article Views (full-text article views including HTML views, PDF and ePub downloads, according to the available data) and Abstracts Views on Vision4Press platform.
Data correspond to usage on the plateform after 2015. The current usage metrics is available 48-96 hours after online publication and is updated daily on week days.
Initial download of the metrics may take a while.