Open Access
Fig. 13
Download original image
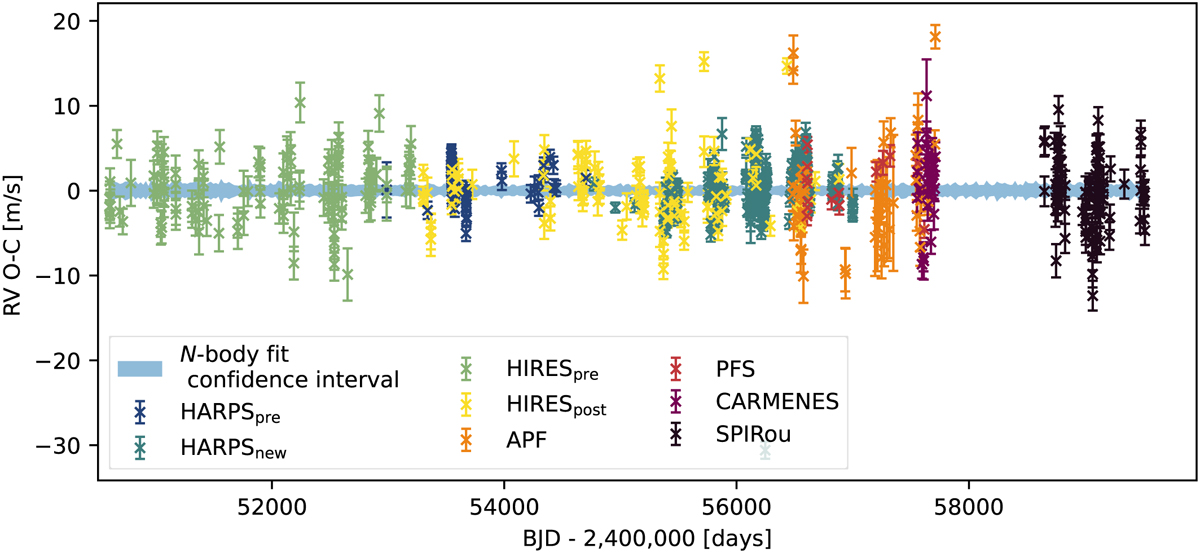
RV residuals obtained by subtracting the instrument offsets and the N-body fit the observed data. The blue shaded region corresponds to the RMS of the modeled RVs of 200 randomly selected configurations from the fit posterior.
Current usage metrics show cumulative count of Article Views (full-text article views including HTML views, PDF and ePub downloads, according to the available data) and Abstracts Views on Vision4Press platform.
Data correspond to usage on the plateform after 2015. The current usage metrics is available 48-96 hours after online publication and is updated daily on week days.
Initial download of the metrics may take a while.