Fig. 16
Download original image
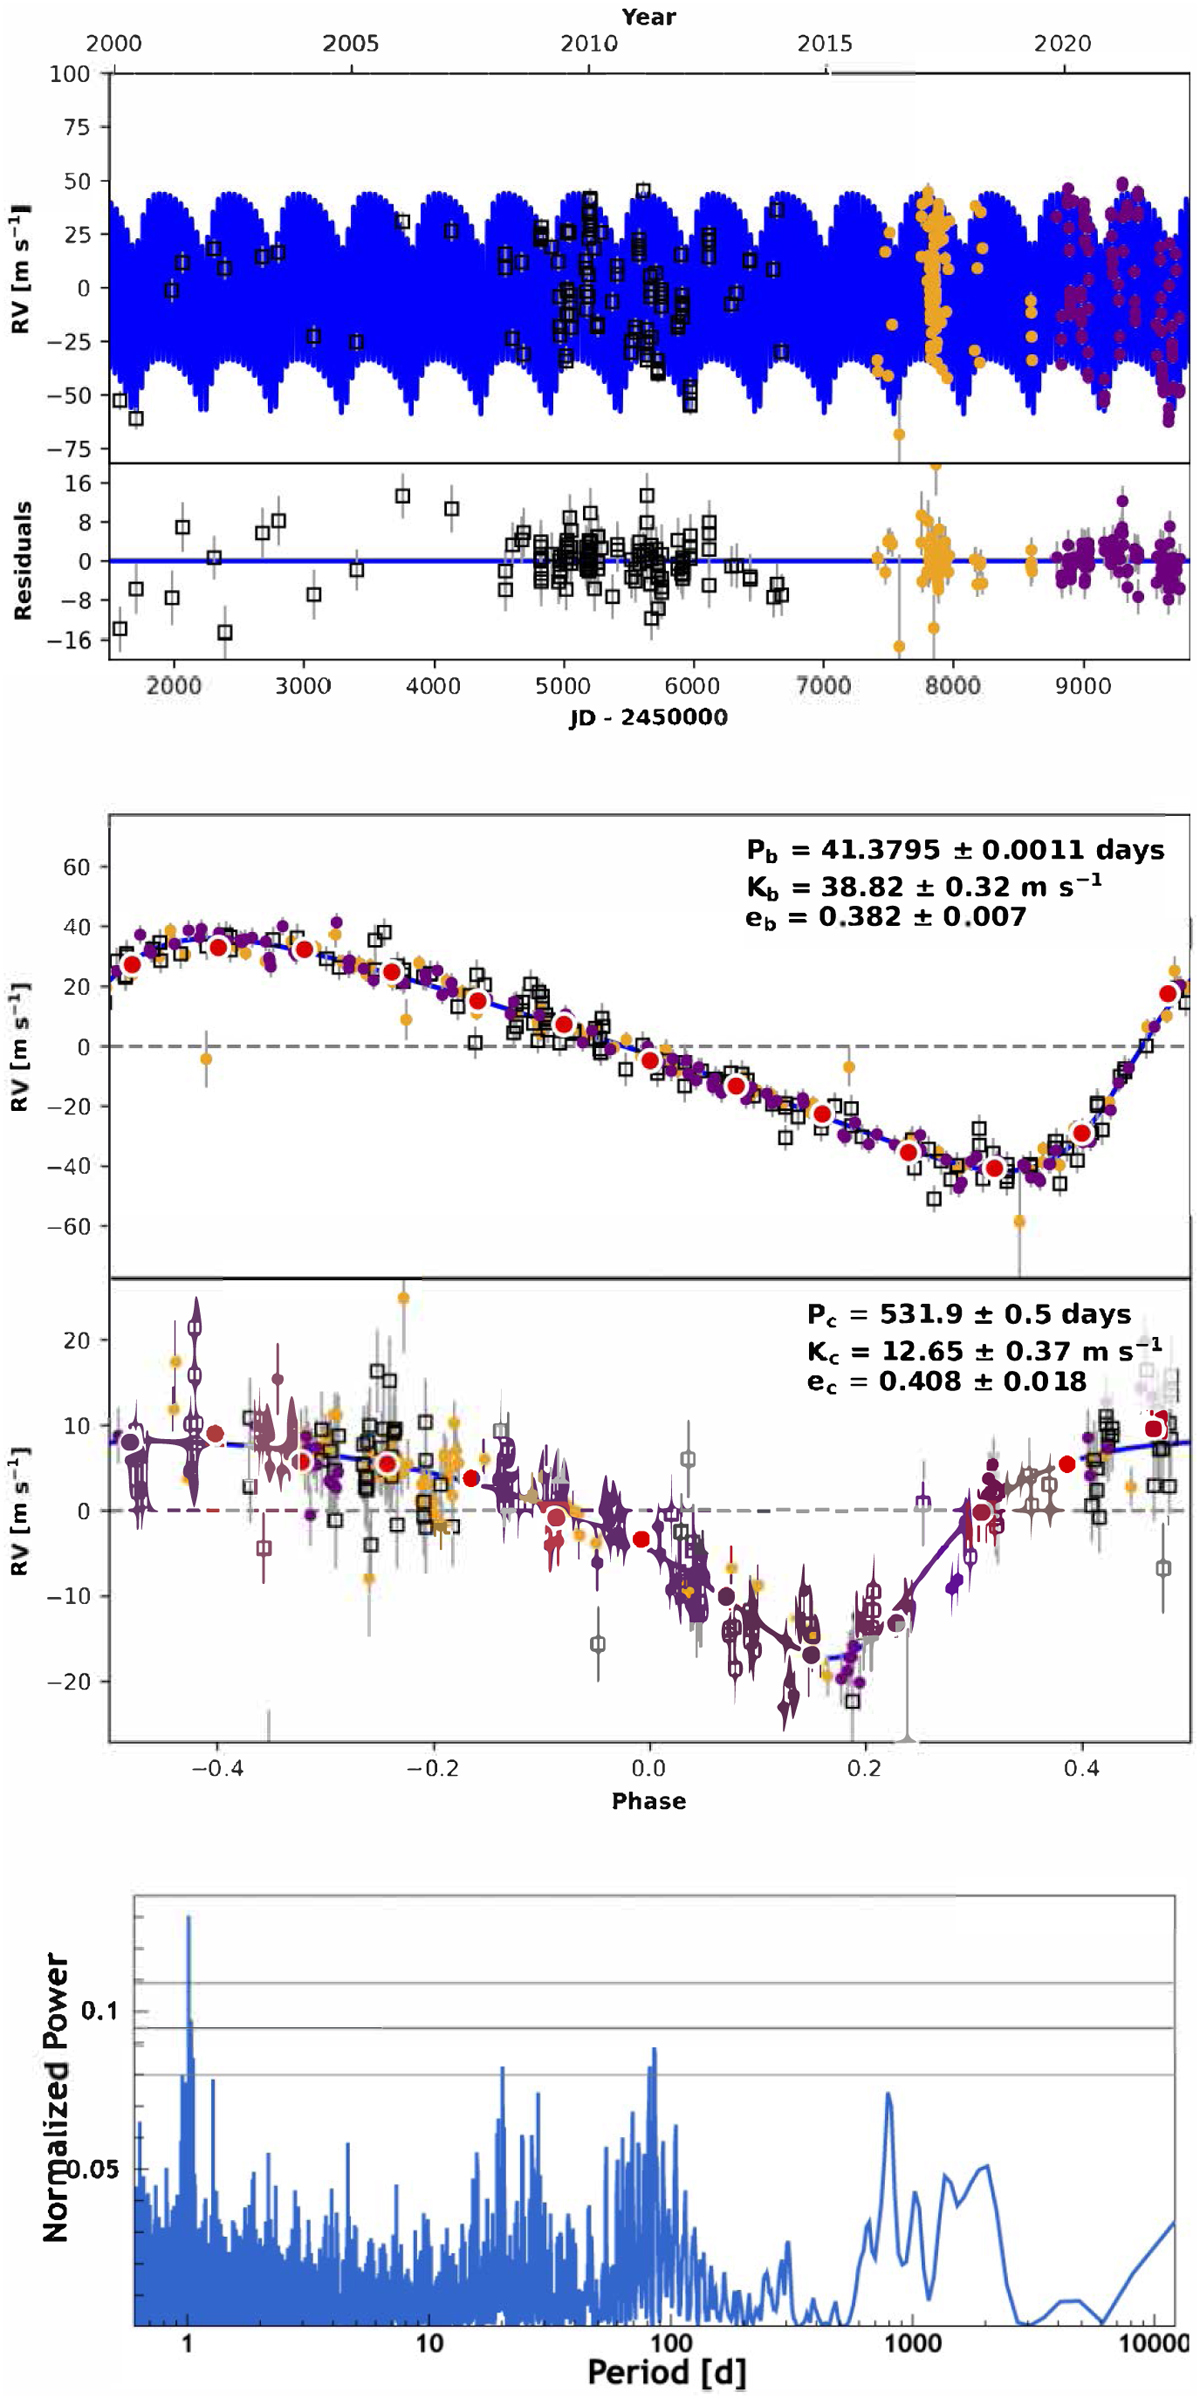
RVs of GJ 1148 and the two-planet fit obtained when using HIRES (open black squares), CARMENES (yellow dots), and SPIRou (purple dots) data. From top to bottom: full signal as a function of time, and the signal phase folded at the period of planet b and planet c. The red dots show the binned data on the phase-folded plots. The RadVel two-planet model is shown as a blue line. The bottom plot shows the periodogram of the residuals, exhibiting an additional peak at the 85 days period. The horizontal lines show the 10, 1, and 0.1% FAP levels.
Current usage metrics show cumulative count of Article Views (full-text article views including HTML views, PDF and ePub downloads, according to the available data) and Abstracts Views on Vision4Press platform.
Data correspond to usage on the plateform after 2015. The current usage metrics is available 48-96 hours after online publication and is updated daily on week days.
Initial download of the metrics may take a while.