Fig. 18

Download original image
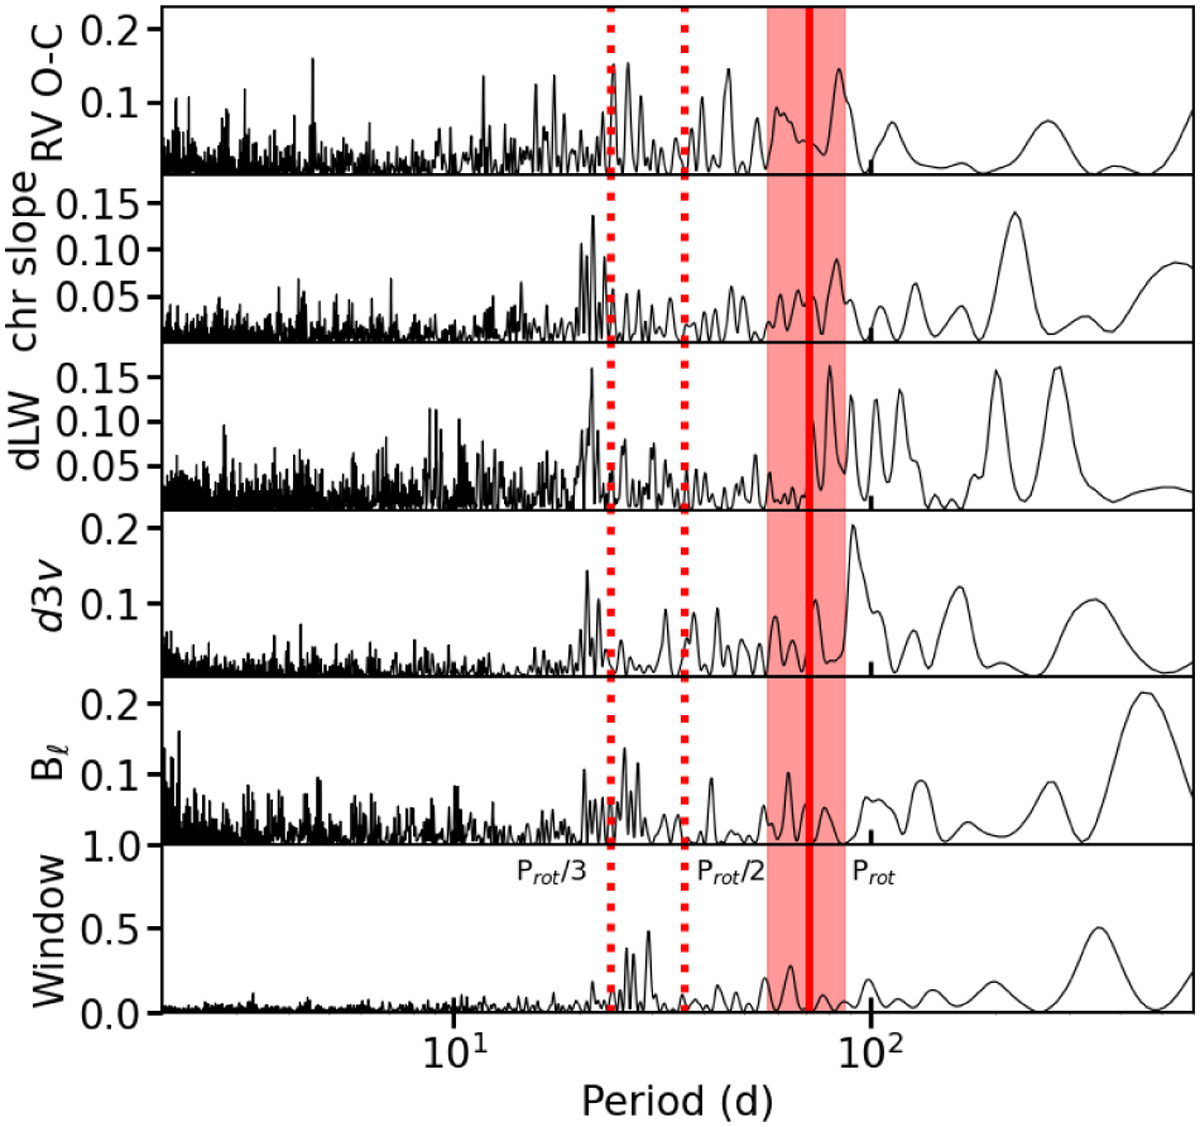
Periodograms of RV residuals (top row), SPIRou ancillary LBL data (next three rows), longitudinal magnetic field, and spectral window (bottom row) for GJ 1148. The red zone shows the estimated rotation period (Díez Alonso et al. 2019) and its 3σ range; the first two harmonics of this rotation period are also shown as dotted lines.
Current usage metrics show cumulative count of Article Views (full-text article views including HTML views, PDF and ePub downloads, according to the available data) and Abstracts Views on Vision4Press platform.
Data correspond to usage on the plateform after 2015. The current usage metrics is available 48-96 hours after online publication and is updated daily on week days.
Initial download of the metrics may take a while.


