Fig. 4
Download original image
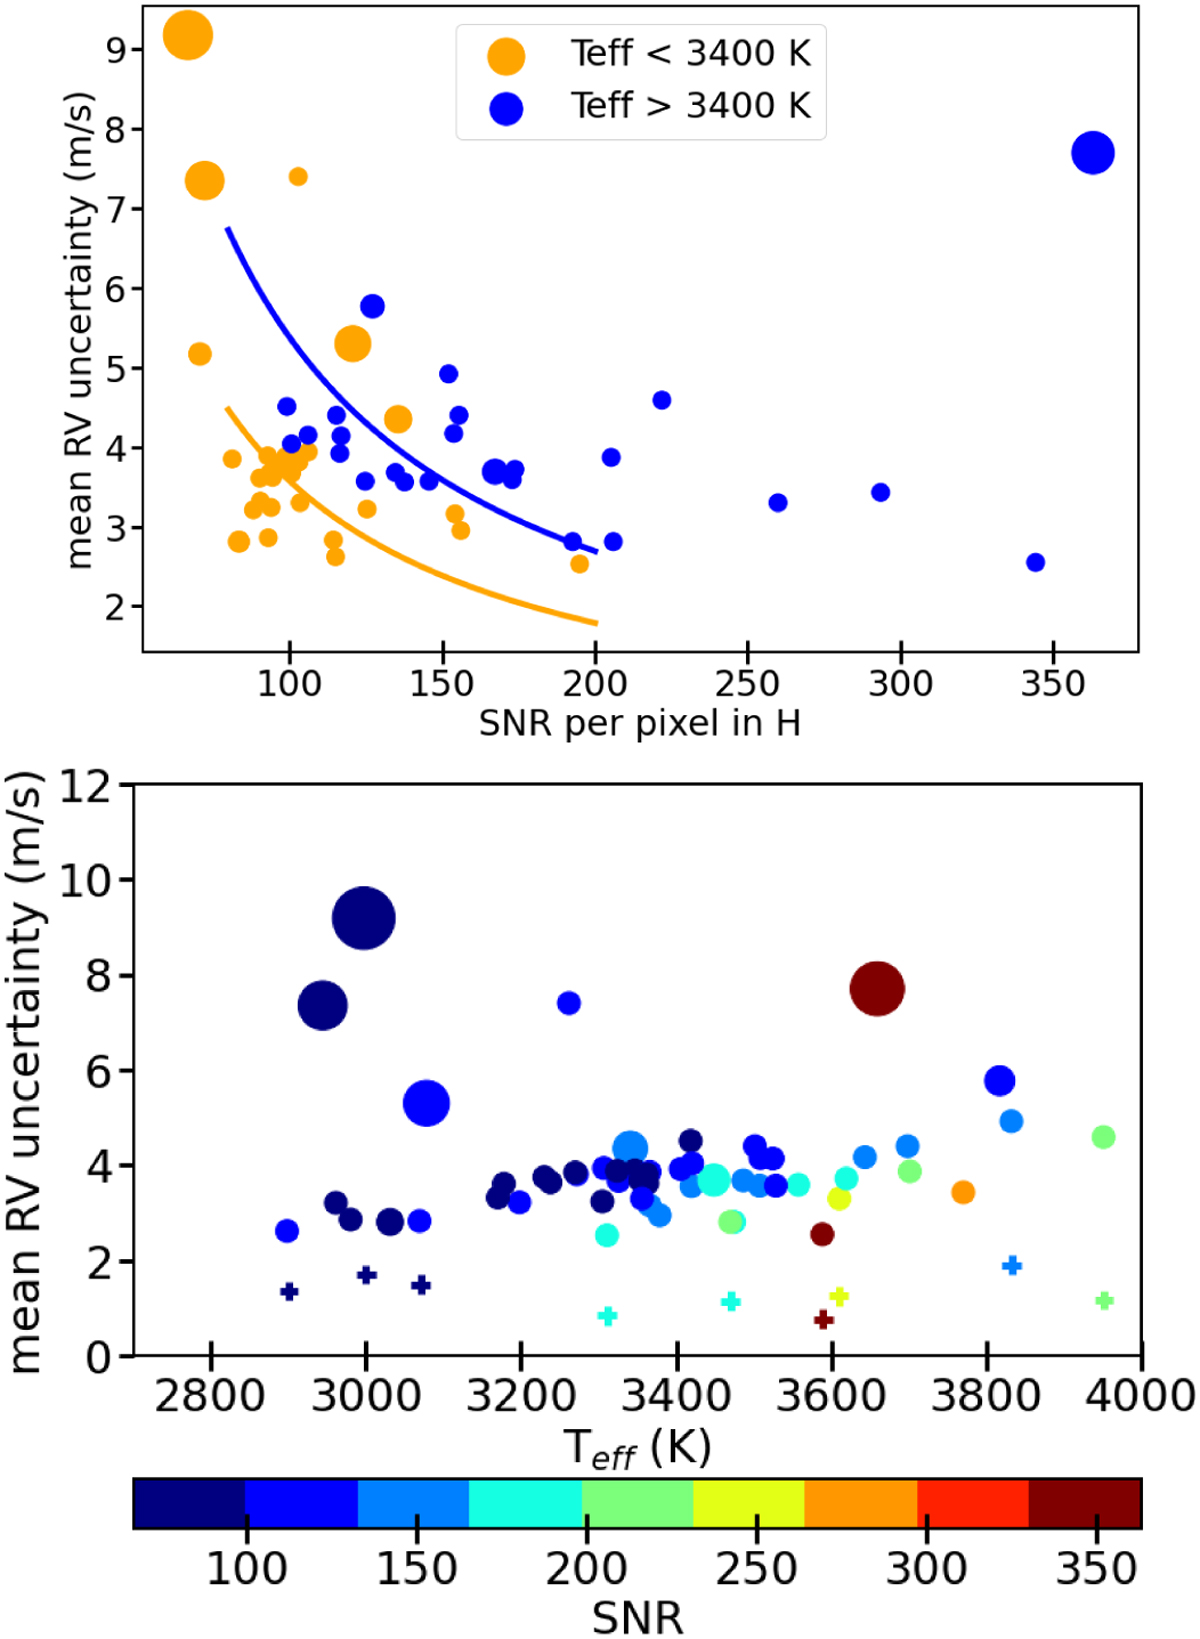
Distribution of the assessed mean RV uncertainty as a function of the mean S/N per pixel in the H band (top) and effective temperature (bottom). The symbol color shows the effective temperature of the star (S/N in the bottom plot), while its size is proportional to the projected rotational velocity. The lines in the top plot correspond to Eqs. (1) and (2) (see text). The crosses show the values derived from Reiners & Zechmeister (2020).
Current usage metrics show cumulative count of Article Views (full-text article views including HTML views, PDF and ePub downloads, according to the available data) and Abstracts Views on Vision4Press platform.
Data correspond to usage on the plateform after 2015. The current usage metrics is available 48-96 hours after online publication and is updated daily on week days.
Initial download of the metrics may take a while.