Fig. 6
Download original image
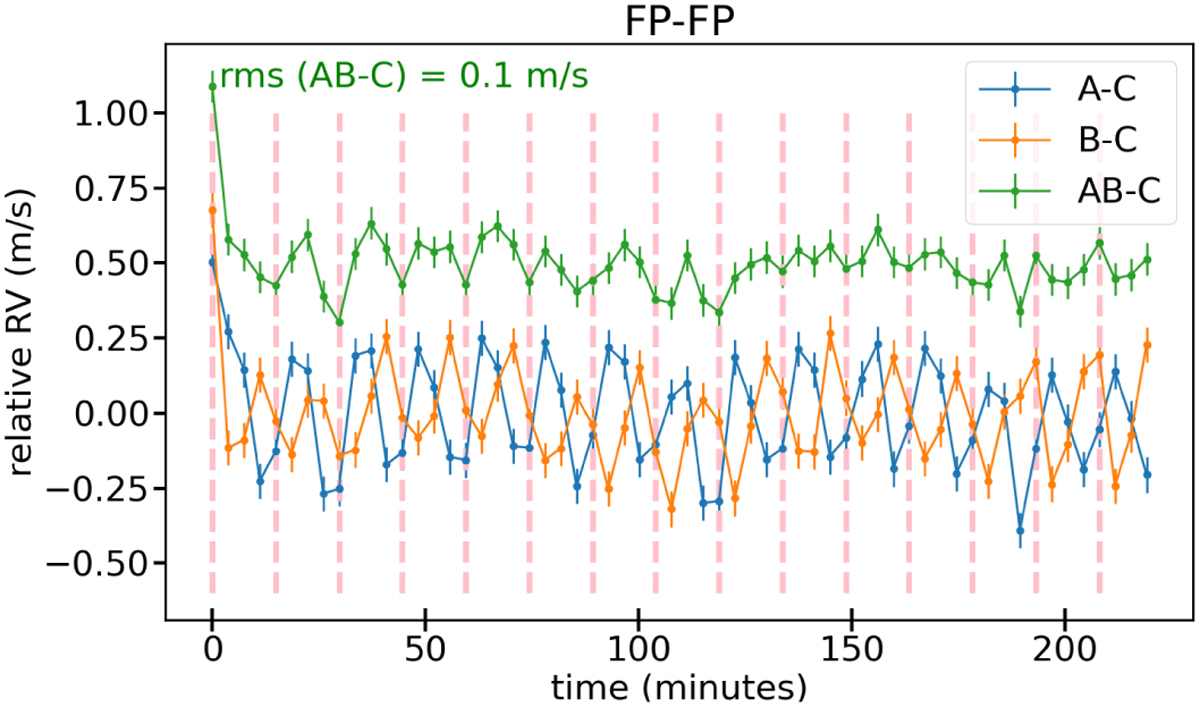
Relative RVs of a sequence of Fabry-Pérot exposures in the science channels (A and B in blue and orange, respectively) as a function of time relative to the first exposure and corrected for the simultaneous calibration channel (C) RVs. The green curve shows the combined science-reference relative RV drift, shifted by 0.5 m s−1 for clarity. The vertical pink lines separate different polarimetric sequences.
Current usage metrics show cumulative count of Article Views (full-text article views including HTML views, PDF and ePub downloads, according to the available data) and Abstracts Views on Vision4Press platform.
Data correspond to usage on the plateform after 2015. The current usage metrics is available 48-96 hours after online publication and is updated daily on week days.
Initial download of the metrics may take a while.