Fig. 7
Download original image
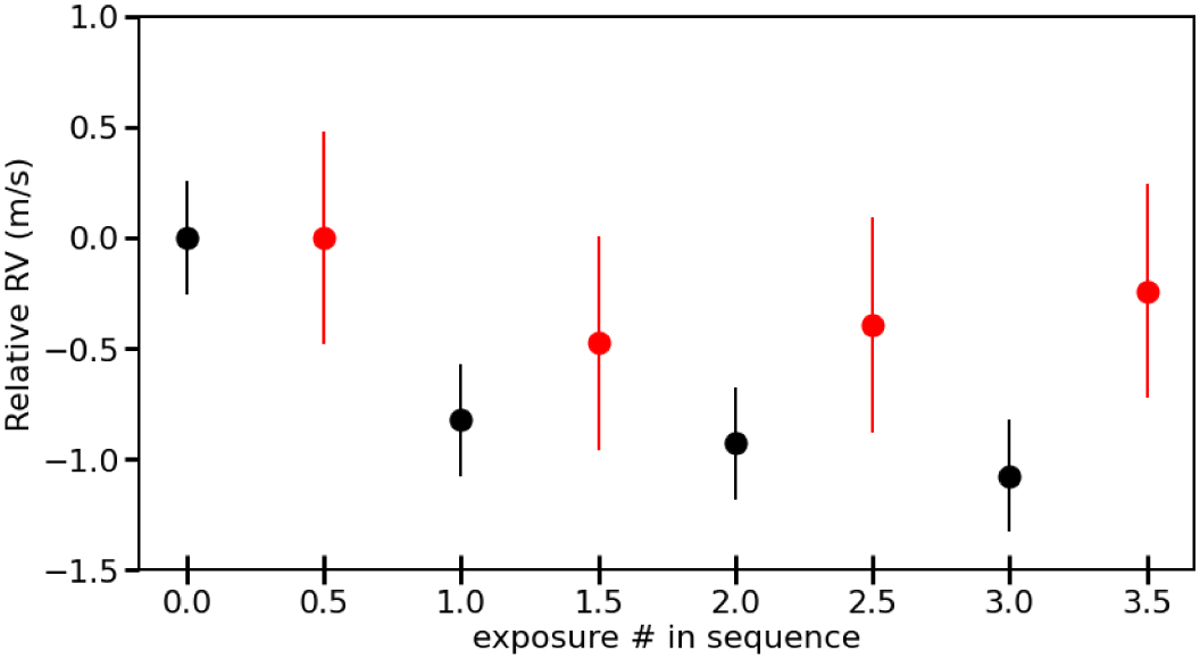
Relative RVs of GJ 15A in the science channel as a function of time relative to the first subexposure, representing the position of the polarimeter. In red we plot the long series of consecutive sequences collected in October 2020, and in black we show the average of all other data. The data points are shifted by 0.5 in X for clarity.
Current usage metrics show cumulative count of Article Views (full-text article views including HTML views, PDF and ePub downloads, according to the available data) and Abstracts Views on Vision4Press platform.
Data correspond to usage on the plateform after 2015. The current usage metrics is available 48-96 hours after online publication and is updated daily on week days.
Initial download of the metrics may take a while.